
Introduction
Major depressive disorder (MDD) is a leading cause of disability worldwide, affecting over 300 million individuals and contributing to substantial social and economic burden (Friedrich, 2017; Malhi & Mann, 2018). Despite the availability of multiple antidepressant classes, treatment outcomes remain highly variable, with up to one-third of patients failing to achieve remission (Rush et al., 2006). This variability has led to growing interest in identifying biological subtypes of depression that may underlie heterogeneous clinical presentations and treatment responses. One promising line of research has focused on neuroinflammation, which is increasingly recognized as a pathophysiological mechanism in a subset of patients with depression (Miller & Raison, 2016; Troubat et al., 2021).
Evidence from both peripheral and central studies supports the involvement of inflammatory processes in depression. Elevated peripheral markers such as C-reactive protein (CRP), interleukin-6 (IL-6), and tumor necrosis factor-α (TNF-α) have been consistently associated with depressive symptoms, particularly anhedonia, fatigue, and cognitive impairment (Haapakoski et al., 2015; Köhler-Forsberg et al., 2017). At the neural level, inflammation has been linked to altered structure and function in regions central to mood regulation and reward processing, including the prefrontal cortex, anterior cingulate cortex, and hippocampus (Setiawan et al., 2015). These findings have given rise to the hypothesis that an “inflammation-positive” biotype of depression exists, characterized by distinct biological and clinical features.
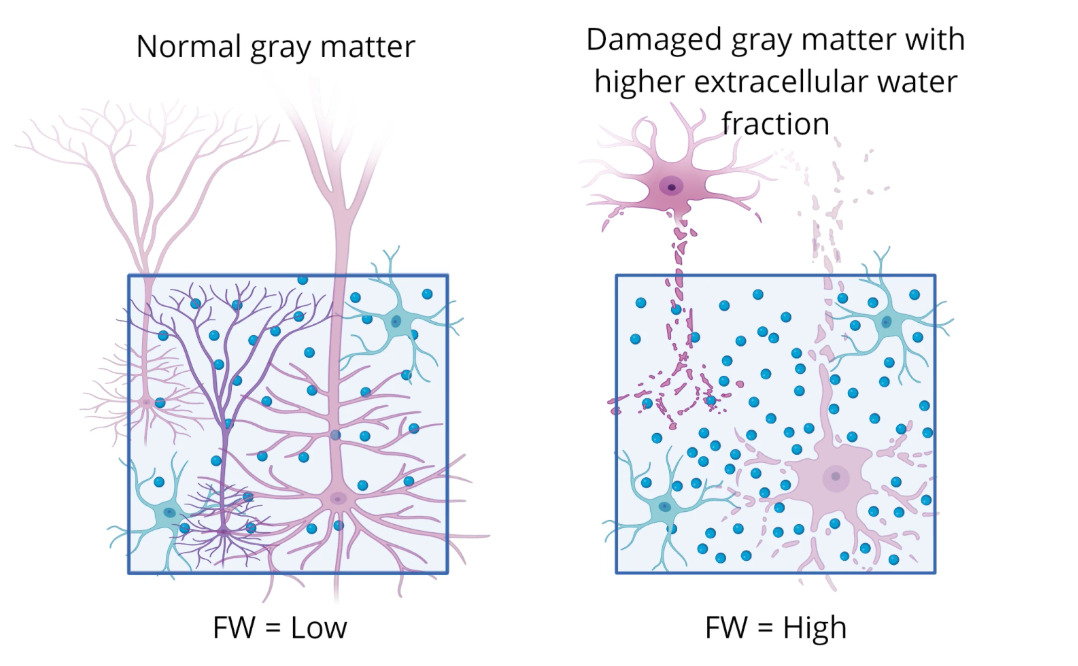
Advances in neuroimaging have provided new opportunities to study inflammation-related brain changes. Free water (FW) imaging, a diffusion MRI-derived measure, estimates the fraction of extracellular water and has emerged as a permission biomarker of neuroinflammation (Pasternak et al., 2009). FW elevations have been documented across neurological and psychiatric conditions, including multiple sclerosis, traumatic brain injury, and schizophrenia, and are thought to reflect microglial activation, edema, or extracellular matrix alterations (Carreira Figueiredo et al., 2022; Lyall et al., 2018). In depression, emerging studies suggest that FW increases are detectable in fronto-limbic circuits and may correlate with symptom severity (Goldsmith et al., 2022). Importantly, coupling FW imaging with volumetric measures of gray matter structure offers a multidimensional view of inflammation-related pathology.
Parallel to biomarker development, clinical efforts have investigated the therapeutic potential of anti-inflammatory interventions in depression. Trials of nonsteroidal anti-inflammatory drugs (NSAIDs), cytokine inhibitors, and lifestyle-based interventions such as exercise have shown mixed but promising effects, particularly in patients with elevated baseline inflammation (Husain et al., 2017; Kappelmann et al., 2018). However, the field has been limited by a lack of reliable brain-based markers that can identify the subgroup most likely to benefit from such therapies. Contrary to these limits, recent preclinical studies highlight novel metabolites with anti-inflammatory properties. For example, the metabolites itaconate and mesaconate have been shown to reduce neuroinflammation and support synaptic plasticity in the hippocampus by attenuating microglial activation and lowering pro-inflammatory cytokines (Ohm et al., 2024). Meanwhile, clinical meta-analyses demonstrate that adjunctive anti-inflammatory treatments, including statins and N-acetylcysteine (NAC), yield greater antidepressant effects when combined with standard antidepressant, suggesting that combination strategies leveraging both conventional and anti-inflammatory agents may be most effective (Du et al., 2024).
Despite this progress, significant gaps remain. Few studies have simultaneously examined free water, gray matter volume, and clinical symptom profiles to define an inflammation-lined depression subtype. Furthermore, the integration of neuroimaging biomarkers with demographic and clinical data could yield more precise stratification of patients and inform targeted treatment strategies. The present study addresses this gap by characterizing free water and volumetric abnormalities in individuals with depression compared to health controls, and by testing whether these brain changes are associated with symptom severity and negative symptom burden. By doing so, this work aims to clarify the neuroinflammatory basis of a distinct depression biotype and highlight its therapeutic relevance.
Methods
Diffusion MRI and T1-weighted data were acquired in 52 affective disorder patients and 68 HCs (men and women 17-36 years old) taken from the Human Connectome Project dataset. The FWI metrics were calculated on diffusion data with b values 0-3000, and the model was fit using DMIPY software. Mean free water (FW) maps were calculated for the 34 bilateral gray matter cortical and subcortical regions derived from FreeSurfer segmentation. The relationship between depressive and negative symptoms and FW was analyzed.
Demographics
The HCP-EP dataset comprises 251 subjects (52 individuals with Affective Disorders (Major Depression, Bipolar disorder and psychosis with depressive episodes) 68 matched healthy controls, Release 1.1). We included subjects with T1w and DTI data (37 DEP and 60 controls). This cohort was composed of 56 females and 103 males aged 17-36 (See Table 1). We obtained approval from NIH/NIMH through a Data Use Certification agreement (Van Essen et al., 2012).
Clinical Scales
The HCP-EP dataset collected several measures of depression and negative symptoms. We used the Clinical Assessment Interview for Negative Symptoms (CAINS) (Kring & Elis, 2013), Montgomery-Asberg Depression Rating Scale (MADRS) (Quilty et al., 2013) and Brief Negative Symptoms Scale (BNSS) tests to assess these symptoms in the dataset.
MRI Protocol
Magnetic resonance images were acquired at IU, BWH and McLean, using 3-Tesla scanners (MAGNETOM Prisma, Siemens Healthcare GmbH, Erlangen, Germany). BWH and IU used a 32-channel head coil, while McLean used a 64-channel head and neck coil, with the neck channel turned off. The scanners collected diffusion MRI with field of view = 210 × 210 mm, voxel size = 1.5 × 1.5 × 1.5 mm3, repetition time = 3230 ms, echo time = 89.20 ms, slice thickness = 1.5 mm (isotropic) and multiband acceleration factor of 4.92 directions in each shell (b = 1500 and 3000 s/mm2) acquired twice: once with AP and once with PA phase encoding (Essen et al., 2012).
This study focused on the 1) T1w MPRAGE (0.8mm isotropic resolution) and the 2) diffusion-weighted MRI sequence ((b=0, 1500 and 3000 s/mm2). More details on the data acquisition parameters can be found on the HCP-EP website. (https://www.humanconnectome.org/storage/app/media/documentation/HCPEP1.1). A free water imaging model was used to obtain free water metrics (Pasternak et al.) (see Figure 1).
Diffusion Data Processing
Diffusion images were first denoised using the MRtrix3 dwidenoise and corrected for Gibbs artifacts. Subsequently, images were corrected for motion and distortions from B0 field inhomogeneities and eddy currents and integrated using FSL topup and eddy (Jenkinson et al., 2012). The FWI model was implemented using Diffusion Microstructure Imaging in Python.
The free water model was used to obtain measures of inflammation:
Statistics
SPSS version 29 was used to conduct statistical tests. We first compared groups based on demographics. We then used Independent T-tests to compare depression versus healthy groups with a p < .05 significant cut-off. We then used Pearson’s correlations to look at the relationship between depression, negative symptoms and free water across groups and in the depression group alone, again using a p < .05 significance cut off.
Results
We found significant increases in FW in those with depression in notable temporal and subcortical regions (e.g., the fusiform), involved in emotion, reward and memory at the p .05 level. We also found a significant positive correlation between FW and more depressive and negative symptoms.
Demographics
Groups were compared based on gender, age, education and the depression scales and were not significantly different. Depression scales were only available for patients except for BNSS, which looks at negative symptoms.
Table 1 (not shown) summarizes the demographic and clinical characteristics of the healthy control (HC) and depressed (DEP) groups. The two groups did not differ significantly in gender distribution (p = 0.973). There were also no significant differences in age (HC: Mean = 24.29 years, SD: 4.081; DEP: Mean = 23.10 years, SD = 4.088; p = 0.966) or years of education (HC: Mean = 8.66, SD = 2.296; DEP: Mean = 6.32, SD = 2.021; p = 0.600).
Negative symptom severity as measured by the BNSS, did not differ significantly between groups (HC: Mean = 14.57, SD = 16.827; DEP: Mean = 16.24, SD = 14.135; p = 0.492). Clinical symptom measures specific to the depressed groups indicated moderate levels of negative symptoms (CAINS: Mean = 13.70, SD = 7.668) and depressive severity (MADRS: Mean = 7.67, SD = 8.622). These measures were not assessed in the healthy control group.
Group Differences Between Depression and Healthy Controls in Free Water
Compared with healthy controls, the depression group exhibited significantly altered free water across multiple brain regions, with the most widespread increases observed in temporal, parietal, and subcortical areas. Within the temporal lobe, significantly higher free water was present bilaterally in the fusiform gyrus, superior, middle, inferior, and transverse temporal gyri, as well as in the banks of the superior temporal sulcus and the right parahippocampal gyrus (all p < 0.05). Parietal lobe differences included increased free water in the bilateral postcentral gyri, right supramarginal gyrus, and right inferior parietal lobule. Table 2 (not shown): Independent t-tests comparing the depression group (N =37) versus the healthy control group (N=60) free water in the brain p < .05 was used as the significance cut-off.
Subcortical structures also showed marked group differences, including significantly elevated free water in the bilateral caudate, bilateral thalamus, left amygdala, right hippocampus, and right ventral diencephalon. The largest group difference was observed in the right thalamus (t = -3.908, p < 0.001). In contrast, several frontal regions—specifically the right rostral middle frontal gyrus, right superior frontal gyrus, and right medial orbitofrontal cortex—demonstrated significantly lower free water in the depression group relative to healthy controls (p < 0.05).
Additional differences were identified in occipital and insular regions, including the bilateral lateral occipital cortex, right pericalcarine cortex, and left insular cortex.
Association Between Free Water and Depression and Negative Symptoms Across Groups
Across groups, higher free water was significantly associated with greater negative symptom burden and depressive severity. The strongest associations were observed in the frontal and temporal regions. In the frontal lobe, BNSS scores showed a robust positive correlation with free water in the right lateral orbitofrontal cortex (r = 0.443, p <0.001), with additional significant associations in the left lateral orbitofrontal cortex, bilateral paracentral lobules, and right superior frontal gyrus (all p < 0.05). A modest negative association was observed between CAINS scores and free water in the left frontal pole (r = -0.234, p = 0.030). Table 3 (not shown): Pearson’s Correlations comparing free water in the brain with depression and negative symptom tests. * = p < .05, ** p < .001
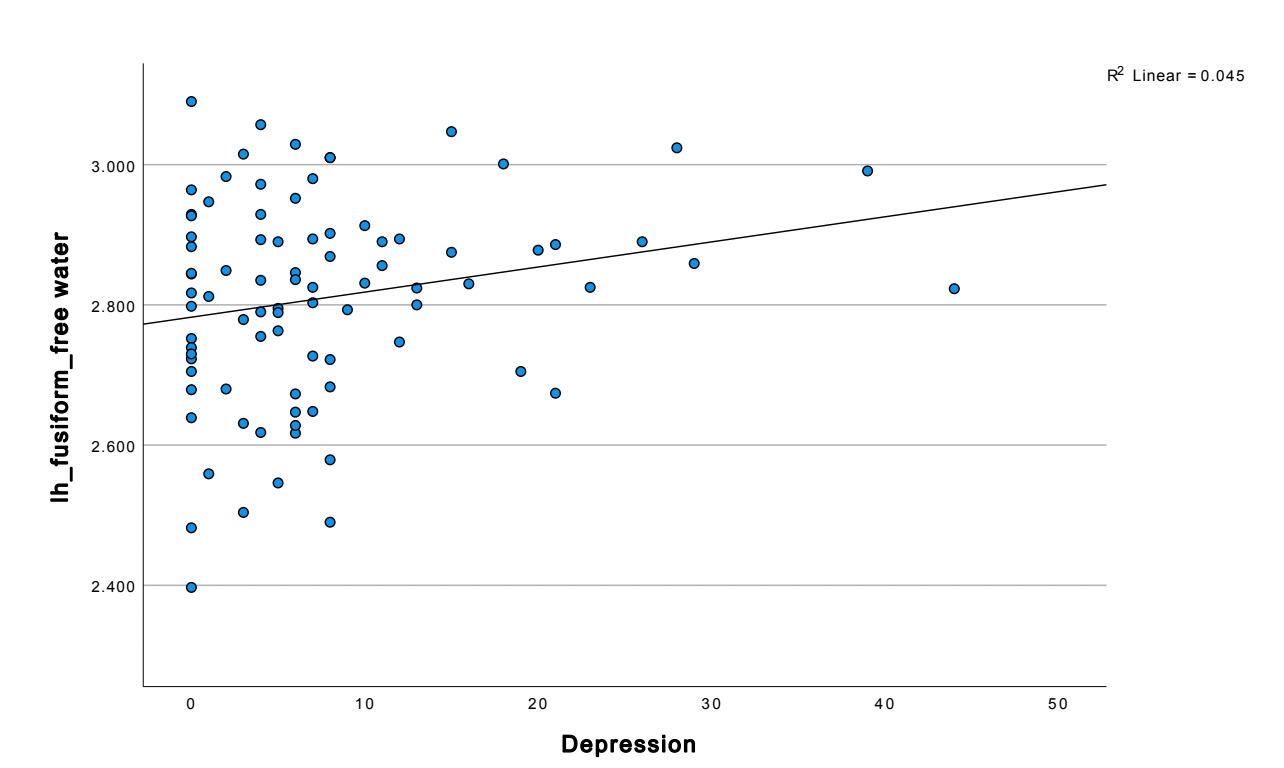
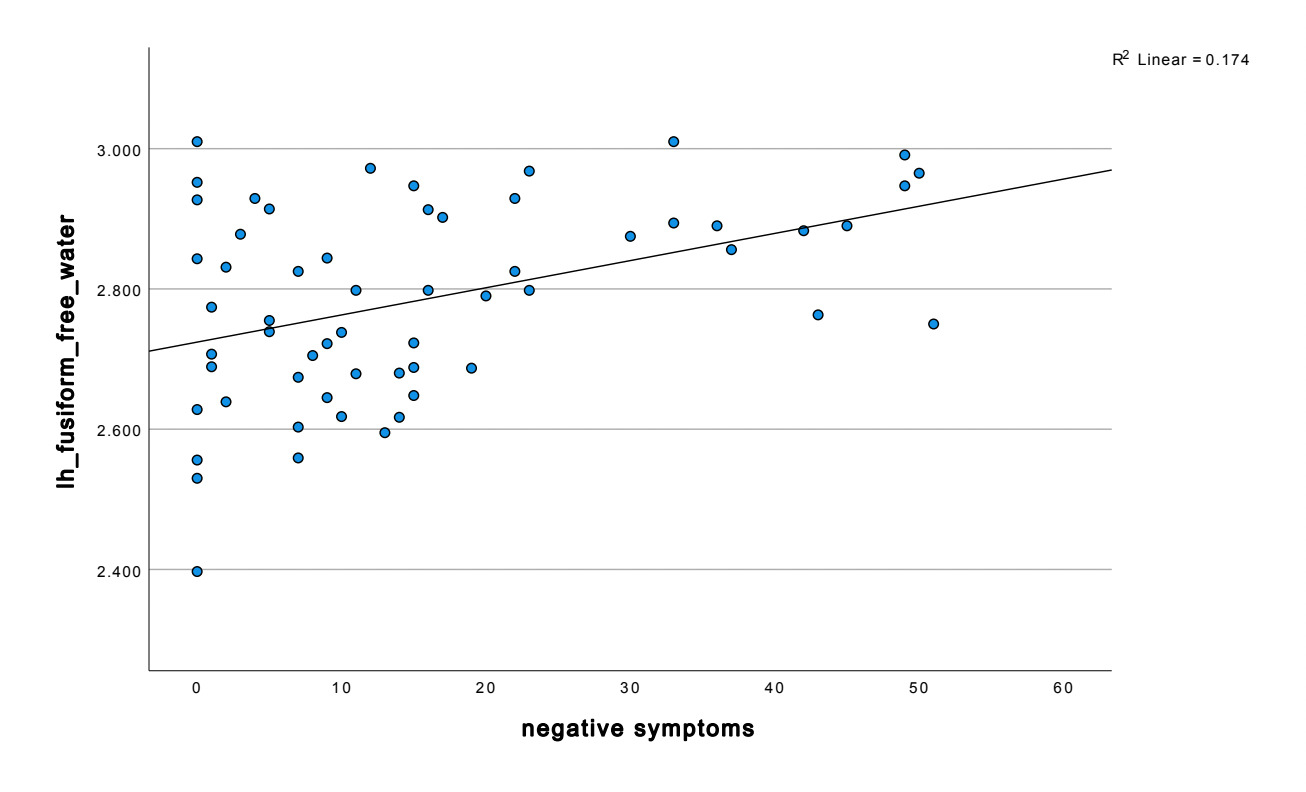
Temporal lobe findings were particularly prominent. Negative symptom severity correlated positively with free water across multiple temporal regions, including the bilateral fusiform gyrus, and middle temporal gyrus (all p < 0.05). The strongest temporal association was observed in the left fusiform gyrus (r = 0.417, p < 0.001). Depressive symptoms also demonstrated a significant relationship with fusiform abnormalities, with MADRS scores positively correlated with left fusiform free water (r = 0.213, p = 0.048).
Additional associations with BNSS scores extended into parietal, occipital, insular, and subcortical regions. In the parietal lobe, significant positive correlations were observed in the bilateral postcentral gyri, right insular cortex, and left inferior parietal lobule (p < 0.05). Occipital involvement was reflected by a positive association between BNSS scores and free water in the left lateral occipital cortex (r = 0.361, p = 0.005). Subcortically, BNSS scores were negatively correlated with free water in the bilateral pallidum and nucleus accumbens, with the strongest effect in the left pallidum (r = -0.340, p = 0.009).
These findings indicate that elevations in free water, particularly within the fusiform gyrus and orbitofrontal cortex, are closely linked to negative symptom severity and, to a lesser extent, depressive symptoms across widespread cortical and subcortical regions.


Discussion
Regional Free Water Elevations and Symptom Associations
We observed robust positive associations between free water (FW) in temporal and subcortical regions and symptom severity, particularly in negative symptoms. Notably, the fusiform gyrus emerged as a “hotspot,” with FW correlating strongly with both GNSS (r = 0.417, p = 0.001) and, to a lesser degree, depressive symptoms (r = 0.213, p = 0.048). This implicated the fusiform not only in social perception but as a potential locus where neuroinflammation may disrupt social-emotional cognition and contribute to effective and negative symptom dimensions. The orbitofrontal cortex also exhibited FW-symptom relationships; given its known role in reward valuation, affective flexibility, and rumination, FW changes there may reflect inflammatory disruption of valuation and cognitive control circuits (Rémy et al., 2015).
Beyond cortical nodes, we detected significant FW associations in subcortical areas, including the thalamus, palladium, and caudate, linking them with the severity of negative symptoms. These findings resonate with models in which inflammation alters reward and motivational circuitry–preclinical work demonstrates that cytokine signaling can impair dopamine regulation and attenuate striatal responsiveness (Felger et al., 2015). In sum, our symptom-FW correlations suggest that extracellular water changes in these circuits may reflect pathophysiological processes relevant to the heterogeneity of depressive and negative symptomatology.
Mechanistic Interpretations: What FW Signals Might Reflect
While FW is not a perfectly specific marker of inflammation, its spatial and symptomatic alignment in our data suggests plausible underlying microstructural processes. One process is microglial activation, which can induce cytokine release, reactive gliosis, and extracellular remodeling. Microglia facilitate synaptic pruning and homeostasis; when chronically overactivated, they may expand extracellular volume or disrupt matrix integrity (Yirmiya et al., 2015). Another mechanism is glial/astrocytic swelling or reactive gliosis, which can push fluid into extracellular compartments, raising FW affected regions (Cieri & Ramos, 2024). Moreover, altered vascular permeability or blood-brain barrier (BBB) dysfunction, often observed in systemic inflammation, may permit fluid shifts that increase extracellular water (Nation et al., 2019). Finally, extracellular matrix remodeling or proteoglycan changes could expand interstitial space, especially in regions with dense synaptic or dendritic architecture. The alignment of FW elevations in high-functioning, socially cognitive regions suggest that these processes may not be diffuse but targeted to circuits relevant to mood, social cognition, and reward.
Comparison with Other Imaging and Histopathological Evidence
Our results align with prior PET, structural MRI, and postmortem findings that implication fronto-limbic, temporal, and subcortical circuits in depression and inflammation. For instance, TSP PET studies have shown elevated microglial binding in the anterior cingulate and prefrontal cortex in depressed patients (Setiawan et al., 2015). Grey matter volumetric studies consistently identify atrophy in hippocampus, orbitofrontal cortex, and anterior cingulate (Schmaal et al., 2017). Our finding that FW elevations occur in some overlapping regions suggest that microstructural inflammation might precede or co-occur with macrostructural volume reductions. In addition, diffusion-based pathology studies using metrics like mean diffusivity, free water correction, or neurite orientation (e.g., NODDI) have reported altered microstructure in major depressive disorder and bipolar disorder (Nazeri et al., 2017). These prior works lend convergent support to the notion that microstructural disruption is a detectable feature of mood disorders, and our FW-based findings may offer additional sensitivity or specificity to extracellular and inflammatory processes.
Therapeutic Implications & Biomarker-Guided Strategies
A central ambition of this work is to bridge biomarker discovery with therapeutic targeting. The differential associations of FW in specific circuits suggest that patients with elevated FW in mood, social, or reward networks might preferentially benefit from immunomodulatory or anti-inflammatory interventions. Indeed, randomized controlled trials and meta-analyses show modest but consistent antidepressant effects of anti-inflammatory agents (e.g., NSAIDS, cytokine inhibitors, minocycline) particularly in individuals with elevated peripheral inflammation (Kappelmann et al., 2016). However, effect sizes often shrink in unstratified samples, suggesting dilution when patients without relevant inflammatory pathology are included. This highlights the potential value of FW as a neuroimaging stratifier: by selecting participations with FW elevations in target circuits, trials achieve cleaner signals of efficacy.
Beyond repurposed anti-inflammatories, emerging translational compounds offer more specific targeting of glial and immunometabolic processes. The metabolites itaconate and mesaconate have recently been shown to attenuate microglial activation, suppress proinflammatory cytokines, and restore synaptic plasticity in preclinical models of neuroinflammation (Ohm et al., 2024). If FW reliably tracks regional glial reactivity or extracellular remodeling, it could serve as both a predictive biomarker (who will respond) and a pharmacodynamic biomarker (monitoring change). Further, modulation of the Nrf2 pathway, mitochondrial metabolism, and microglial polarization are emerging as therapeutic axes in neuropsychiatry (Mayer et al., 2024). Combining FW imaging with these emerging interventions promises to elevate translation from descriptive imaging to targeted therapy.
Limitations & Future Directions
Our study has several limitations that temper interpretation and guide next steps. First, the cross-sectional design precludes inference about causality, whether FW elevation precedes symptom onset or is a downstream consequence of chronic depression. Longitudinal imaging studies will be essential to map trajectories of FW, volumetric change, and symptom dynamics. Second, FW is an indirect measure of extracellular fluid fraction; it cannot disambiguate among glial swelling, edema, matrix, expansion, or vascular leakage. Multimodal validation will help clarify its specificity. Third, although our focus was on FW, combining FW with volumetric diffusion tensor, or neurite density metrics may enhance mechanistic resolution. Fourth, the HCP-EP dataset includes heterogeneous affective diagnoses (e.g., bipolar with depressive episodes), and medication effects or comorbidities may influence FW; these could not be fully controlled. Fifth, although preprocessing attempts to harmonize across imaging sites, residual scanner/sequence variance is possible. Finally, subgroup sample sizes limit the power to detect more subtle regions: symptom links or categorized treatment predictions.
Moving forward, several directions are promising. A next logical step is a prospective biomarker-stratified clinical trial, enrolling participants with FW elevations in target circuits (e.g. fusiform, OFC) and testing immunomodulatory or glial-targeted agents, with FW and symptom response measures longitudinally. Such a design would test the key assumption: that reducing FW (i.e., reducing extracellular/inflammatory burden) yields symptomatic benefit. Equally important is validating FW against orthogonal biomarkers (TSPO PET, cytokine panels, microglial transcriptomics in animal models) to confirm its mechanistic value. Integration of FW imaging with peripheral biomarkers and genomic data may create composite stratifier models with higher predictive accuracy. Moreover, exploring network-level functional connectivity between fusiform, OFC, and reward circuits in relation to FW may help link microstructural alterations to large-scale network dysfunction. Lastly, translational animal models that manipulate inflammation and image FW analogs (e.g. diffusion imaging in rodents) can validate signal interpretations and guide target decisions for human trials.
Conclusion
Our findings suggest that neuroinflammatory processes may underlie symptom severity in some individuals with depression, as reflected by regional increases in FW. Future studies could leverage FWI to evaluate anti-inflammatory therapies and identify inflammation-linked depression subtypes.
Our findings show that FW elevations in fusiform gyrus, orbitofrontal cortex, and subcortical reward and regulation nodes are meaningfully associated with negative and depressive symptoms. These associations, their circuit specificity, and alignment with mechanistic models of glial dysfunction support the conceptualization of an “inflammation-positive” depression subtype. Moreover, FW imaging holds promise as a neuroimaging biomarker that can categorize individuals for targeted immunomodulatory therapies and track treatment response. As psychiatry increasingly embraces precision neuroscience, bridging biomarker development with translational clinical trials will be essential to move from correlation to causation.
Looking ahead, subsequent studies should integrate FW imaging with longitudinal and interventional study designs to evaluate regional FW metrics as a dynamic indicator of treatment-sensitive related neuroinflammatory processes. Incorporating FW-based stratification into clinical trial design may improve signal detection by enriching samples for individuals with elevated neuroinflammatory burden, particularly within reward and socio-affective systems. Parallel integration of FW measures with peripheral immune markers and functional connectivity analyses may further refine patient subtyping and clarify mechanistic pathways linking inflammation to symptom expression. Collectively, leveraging FW imaging to identify and monitor neuroinflammatory burden may enable more targeted experimental therapeutics and thus improve biological specificity in mood disorder treatment.