Introduction
For years, New Jersey has been renowned for its healthcare. Its healthcare systems and other institutions are praised by native and non-native residents for their efficiency and accessibility, based on how clearly policies and procedures are both outlined and adhered to . According to a census by the U.S. News Report, New Jersey’s healthcare system currently ranks fourth in the nation, preceded by Connecticut, Massachusetts, and Hawaii (U.S. News, n.d.). However, this sampling fails to include metrics on public accessibility, where resources such as ramps, elevators, and handicapped parking spaces are available to those with physical disabilities. In the context of this research, the terms “physical disability” and “disability” are used interchangeably and can be defined as, “a condition that substantially limits the ability of a person to perform basic physical activity” (Anderson et al., 2019, p. 1).
Increased accessibility resources are important in churches, stores, parks, and other public spaces because they are multi-generationally populated. Before the COVID-19 pandemic, these challenging spaces were starting to become the focus of accessibility-based city improvements before quarantine mandates and a switch to an intense focus on health centers during the rise of the pandemic deferred their prioritization, with a large emphasis on the $14 billion Economic Recovery Act seeking to address the ongoing impacts of the pandemic.
Today, a renewed initiative to provide disabled people with improved public resources and quality of state-funded programs has become both a political and social topic of conversation around New Jersey following the preposition of platforms such as the Inclusive Healthy Communities grant that seeks to provide support in towns statewide to improve accessibility resources. With a large population of varying age ranges, public institutions in different counties of New Jersey have increased their demand for funding from municipal and state governments to establish accessibility resources; however, the fulfillment of these demands is often subject to the purview of the socioeconomic priorities of the county in New Jersey in which the institution is located although these socioeconomic standings are not always made clear. Hence, this review explores the following: how does allotted government spending to accessibility-based public resources, state-sponsored programs, and advocacy groups for those with physical disabilities vary between townships with different socioeconomic statuses and priorities? To answer this question is to provide both the disabled population of New Jersey and the state legislature with an in-depth cause-and-effect analysis of accessibility resulting from socioeconomic factors that have otherwise been generally overlooked due to other focus areas.
Research conducted by the U.S. Center for Disease Control (CDC) corroborates the story of New Jersey with telling fact: that there are far too many people with disabilities for accessibility to be ignored. Twenty-three of adults–approximately 1,592,077 people–in New Jersey have a disability. Ten percent, or roughly 160,000 of these adults have a mobility-based disability, which is classified as “serious difficulty walking or climbing stairs” (CDC, 2024). A map created by the University of Montana’s Research and Training Center on Disability in Rural Communities in New Jersey ranks the concentration of physically disabled people in a certain county on a scale of 8.0%-15.5% (percent of the county’s entire population). According to this map, the counties with the highest concentration of physically disabled people are located in southern New Jersey, which coincides with a map of “Mobility Difficulty Rates,” also created by the University of Montana in which the more urbanized counties have the highest rates (University of Montana, n.d.). In response to these disproportionate statistics post-pandemic, New Jersey has made several efforts to help the affected communities and induce large-scale accessibility resource recognition. One such effort has been spearheaded by the Inclusive Healthy Communities Grant Program (IHC) which awarded over $3 million to over 30 different municipal and state-sponsored programs by way of 13 grants, completed in 2023 (Department of Human Services NJ, 2023).
By mobilizing these grants, New Jersey was able to minimize the drawbacks resulting from the pandemic and create a blueprint for a future in which accessibility remains a significant focus for the state. Despite this attempt at a resolution, the facts still loom large. By median family income, the New Jersey counties that have the highest rates of mobility difficulty and the highest rates of disability are the same counties that rank last regardless of race, sex, or age (National Institute on Minority Health and Health Disparities, 2023). This low-income, high-disability concentration problem has plagued New Jersey’s efforts to provide equitable accessibility resources in needy areas. The number of advocacy groups for public resources for those with physical disabilities differs by town, furthering inequities in communities that are already marginalized. By assessing census data from both the U.S. Census database and the New Jersey Census database, along with examining state financial plans for the past three years, the intentionality of government spending towards accessibility can be broken down into simple statistics alongside an analysis of how different demographics including age, sex, race, income, etc, vary in response when it comes to identifying issues of disability accessibility.
Literature Review
The current state of the healthcare sector has been an important discussion topic at the federal level due to the amount of funding it requires, with a fair share of disagreements as to whether all that falls under the umbrella term of “healthcare” should be financed by the federal government. Reinhardt (2003), compares health spending between the U.S. and other countries, the findings of which remained relatively similar when the study was replicated in 2019 by his students. Compared to other industrialized countries, factors such as the establishment of public resources, administration costs, and “real” resources (nurses, hospital beds, physicians, etc.), yield a much higher cost in the U.S. than in other countries (Anderson et al., 2019, p. 1). Reinhardt argued that since the U.S. provides significantly fewer resources compared to the Organization for Economic Cooperation and Developments (OECD) median country, the increased cost can only result from the high prices that the U.S. charges for its healthcare services.
Similarly, a theory posited by Karen Davis, president of the Commonwealth Fund, suggests that an increase in specialized services under Medicare raises the possibility of “physician” induced demand as opposed to the single “resource” induced demand (Davis, n.d., p. 1). Simply put, if Medicare were restructured and allowed an increased capacity for hiring healthcare providers, funding currently focused on producing medication and equipment could be used elsewhere, such as providing public accessibility. The skewed allocation of access was exceedingly obvious following the pandemic when the closure of schools and many workplaces meant that people with physical disabilities who relied heavily on government assistance had to find further alternative means to provide for themselves, resulting in disabled children lacking access to meal programs, assistive technologies, and recreation programs (World Bank Group, 2023).
To understand the importance of providing accessibility resources for those with physical disabilities, the first key factor is where the resources obtain financial backing. A large portion of funding for those with disabilities comes from assistance programs such as Supplemental Security Income (SSI)–which provides $735 a month for a single person with automatic qualification for Medicaid–and Security Disability Insurance. However, 29% of disabled Medicare beneficiaries still opt to reduce medication dosage or fail to fill prescriptions due to cost despite the increased ability of their patrons to pay (American Psychological Association, 2010). In the public sector, accessibility standards for places of public accommodation, commercial facilities, and state/local government facilities are set by the Americans with Disabilities Act (ADA) and enforced by the Department of Justice (DOJ) by way of investigation into complaints filed with federal agencies as there is no plan review or permitting process under the ADA. This means that accessibility standards within a state are solely dependent on the state, emphasizing the need for advocacy groups that work to convince the state of the importance of improved accessibility resources unless federal assistance is requested. Most of the time, this assistance will only be provided in the form of creating new facilities, meaning pre-existing facilities may be unable to update their accessibility provisions as they are not prioritized and hence do not receive equal funding be it monetary or physical (U.S. Access Board, n.d.). Despite these efforts by the ADA, disability-related complaints remain the largest category filed with the federal agencies that enforce fair housing and employment laws, resulting from the inaccessibility of businesses and institutions. This trend has only seen an increase following the COVID-19 pandemic (The Times, 2020, p. 3).
As both the state and federal governments work to provide the necessary accessibility resources there has been a rise in spending on health services nationwide, signaling a potential push for the federal government to increase provisioned budgets and facilitate both the development and improvement of accessibility resources. In 2022, National Health Expenditure grew to $4.5 trillion, averaging about $13,493 per person, and the largest shares of total health spending were sponsored by the federal government, with 33% of total health spending, followed by households with 28% of total health spending (Centers for Medicare and Medicaid Services, 2022). In 2023, federal spending on domestic and global health services and programs accounted for 29% of net federal spending in the fiscal year. Federal expenditures come in the form of Medicare, Medicaid, and the Children’s Health Insurance Program (CHIP), of which almost all of Medicare spending is mandated by existing laws, covering over 65 million older adults and younger people with long-term disabilities. Programs like CHIP and Medicaid are jointly funded by states and the federal government (Cubanski et al., 2023). The issue with current federal healthcare spending is that the U.S. has reached the $36 trillion debt limit, the maximum amount of money the government is legally authorized to borrow to cover federal spending–including healthcare.
While Congress has been continually lobbied to raise the debt ceiling, over the past two decades there have been many failed attempts at agreeing on a budget solution. This creates the need for discretionary spending, of which the chambers can decide how money is to be distributed. Oftentimes, the chambers will work in collaboration on extreme spending issues, resorting to solutions such as payment delays, prioritizing payments, and automatic across-the-board payment reductions. These solutions are grouped under the umbrella term “sequestration,” a budgeting tool requiring automatic federal spending reductions in many areas. However, areas of healthcare spending like Medicaid and Medicare are partially exempt from this action, with other policies in place to prevent further siphoning off money from these programs (Cubanski et al., 2023). The prevention of sequestration impacting Medicaid and Medicare is a sign of proactivity from the government when it comes to making sure that funding is delegated appropriately, especially important in the case of those with physical disabilities who receive very little from the federal level already and rely heavily on state government.
Governor Phil Murphy’s New Jersey state budget for the 2024 fiscal year appropriates $53.1 billion of government funds. Of this, $200 million will be allocated to municipal governments to address rising health benefit costs along with certain long-term saving reform measures established by the state government. This initiative is the continuation of “Get Covered New Jersey” (GCNJ), a state marketplace where individuals and families can shop for and buy health coverage to increase access to affordable, high-quality health insurance for residents (NJLM, n.d.).With initial groundwork started in 2019, GCNJ was originally an attempt to introduce low-income families to state-provided, accessible healthcare. This marketplace presents joint-funded assistance in the form of Medicaid and CHIP and also provides resources for those who are both physically and mentally disabled. However, these programs do not cover accessibility-based public resources, many of which New Jersey has centered around the transportation sector with county paratransit providers, and Access Link bussing amongst others. Notably of the most commonly used method of transport, regional train systems, only 60 out of 161 stations are accessible to those with physical disabilities (Alan M. Voorhees Transportation Center, 2005, p. 3).
Besides transportation, public resource provision can vary from county to county as each must create its own programs. The difference between these counties can be seen in both median household income and the demographics of the area, where the socioeconomic status of both the disabled and non-disabled population begins to play a large role in the average amount of accessibility resources found in each county. According to a state-wide census, the median household income in Somerset County is $131,948, making it the richest county in New Jersey, and the ratio of white to non-white residents is 69 to 9 (Carney, 2024). The county can delegate all responsibility for disability resources to a local group called Somerset County Office on Aging and Disability Services with little to no joint programming with the state. Essex County, however, with a median household income of $73,785 and a 29 to 37 ratio of white to non-white residents (Data USA, 2023), relies heavily on joint programming from GCNJ and volunteer-founded groups, which can often create disjointed leadership, yet it is only through these volunteer-founded advocacy groups that adequate funding can be demanded, putting those with disabilities at a huge disadvantage compared to a county such as Somerset. Similarly, in more rural counties (defined by the state of New Jersey as having a population density of fewer than 500 people per square mile) such as Salem County, designated last in the demographic of “New Jersey’s Richest Counties,” the offices of Aging and Disability Services rely less on local government and more on the help of volunteer programs such as The Arc of Salem County alongside state and federal programming. Salem’s demographic is typical of a New Jersey rural county in which the ratio of white to non-white population percentages is 72:14 (Data USA, 2023).
Across the United States, as reported by the American Psychological Association, socioeconomic factors play a large role in the accessibility of resources for people with physical disabilities. Median earnings for people without disabilities were over $30,469, compared to the $20,250 reported for people with physical disabilities (U.S. Census Bureau, 2015). According to a study conducted by researcher Carolyn T. Halpbern, young adults who reported having a physical disability had lower educational attainment, ranked themselves lower on the socioeconomic status (SES) ladder, and were less likely to have professional/managerial occupations (Queirós et al., n.d., p. 1). The same study also noted that young adults are the least studied age group for any type of disability, resulting in their needs being poorly understood in both the education and public accessibility sectors. In regards to older people with disabilities, according to a study conducted by the Department of Epidemiology and Public Health of the University College in London, both men and women who had the highest levels of wealth, education, and social class reported the lowest disability rates. Still, for men, socioeconomic gradients in physical disability were greater (Gjonça et al., n.d., p. 1).
In both young and old people with physical disabilities, race is a very pertinent socioeconomic boundary. The CDC reported that 3 in 10 American Indian Alaskan Native people are disabled, 1 in 4 Black people are disabled, 1 in 5 white people are disabled, and 1 in 10 Asian people are disabled. Counties that are typically populated with those who have lower socioeconomic status are less accessible to those with disabilities since there is little wealthy representation of the groups.
Methodology and Results
To fully grasp the concept of socioeconomic barriers and how they pertain to public health regarding physical disability, this review utilizes data from the U.S. Census and the publicly available New Jersey Health Assessment as the combination of the two provides a holistic view of the disabled population and their experience as opposed to simply using one or the other. The national census data is derived from both the 2020 National Census and the 2022 American Community Survey utilizing both one- and five-year estimates, providing diverse data spanning the periods. For the census and the Health Assessment, this review focuses on select SES indicators such as gender, age, employment status, income level, and ethnic background regarding disability status by county in the New Jersey Health Assessment. For the gender aspect, data is about men and women. These are important demographics to understand as there are large differences in how female participants identify in the study versus male participants. In the age overview, the data referenced represents the 35-64 age group as they were reported to have the highest disabled population. To determine employment status, the data from the Census used a simple “yes or no” answer format. At the same time, the median income level this review looks at is an average number per county. These are some of the most important socioeconomic factors that the data overview touches upon as they can provide similarities between different demographics.
Whilst the subjects for the U.S. Census are more difficult to pin an exact number on, it was relatively easy to collect data by county from the New Jersey Health Assessment and by first generating a map of the counties with the highest rates of physical disability, then focusing on SES indicators with a focus on extremes; the counties with the highest and lowest percentages of physically disabled residents. It is important to note that although relatively accurate, the data and percentages are not descriptive of every physically disabled resident of the county/member of an SES indicator group as all of the data are presented in the form of an average. These averages are still a very efficient method of data collection as they represent the majority of the group, providing concise and telling statistics.
Results
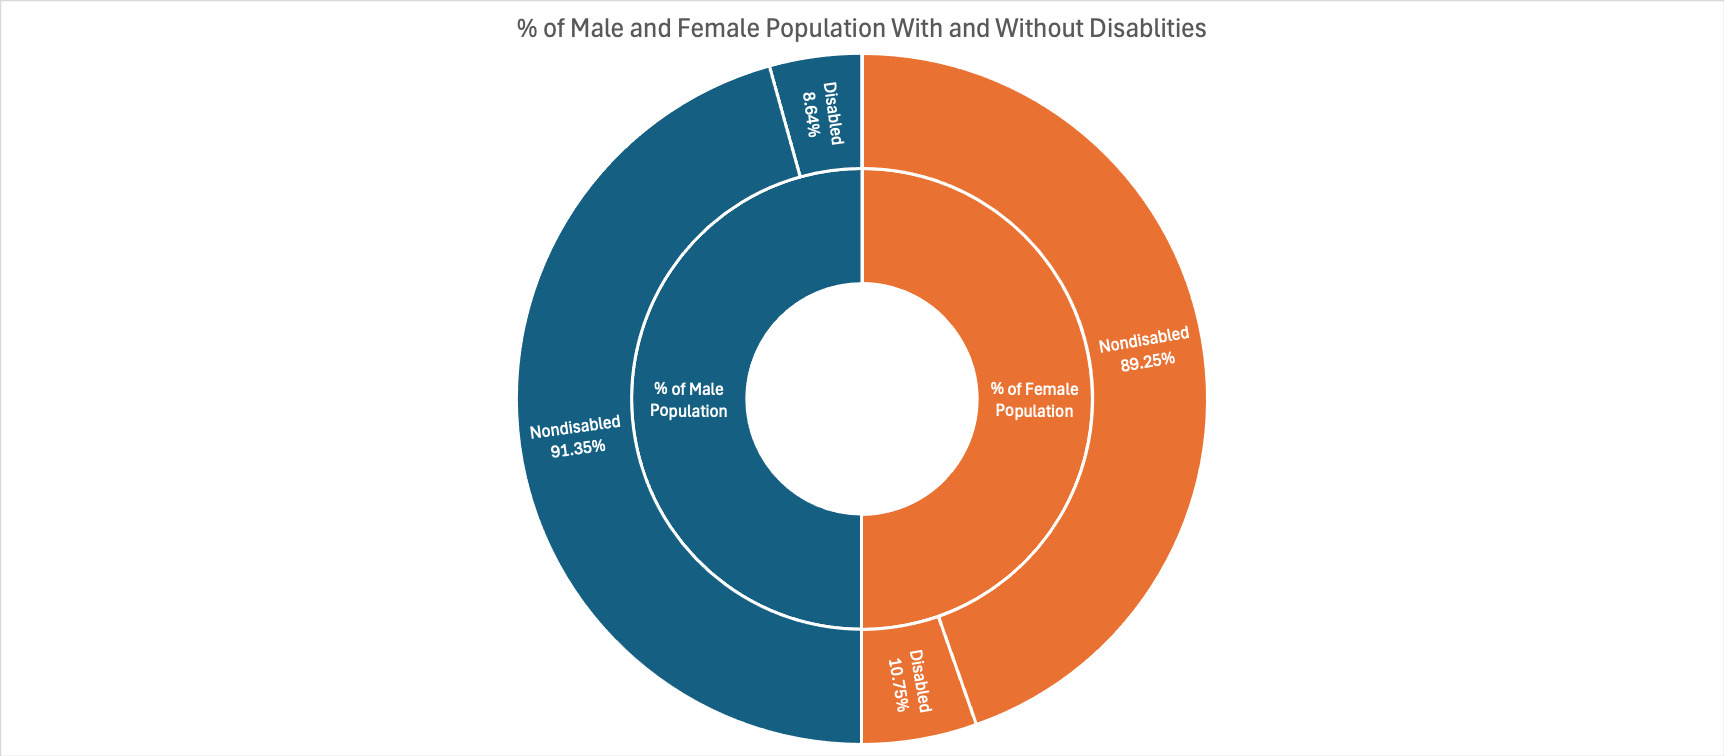
According to the American Community Survey, a descriptive demographic analysis, the percentage of the male population in New Jersey with a disability is 10.5%, whereas the percentage of the female population is 12.0%, already hinting at a clear socioeconomic barrier which suggests women are more likely to be disabled in New Jersey and face challenges otherwise unknown to their male counterparts. (American Community Survey, 2022). Since the start of the previous decade, the New Jersey State Health Assessment has reported that the male percentage number has increased by 1.4% and the female percentage by 1.7% (New Jersey Department of Health, 2024). For both genders, the group with the most reported disabilities is between the ages of 35-64, in which 156,024 out of 1,805,385 (8.6%) males reported a disability and 198,707 out of 1,847,906 (10.7%) females reported a disability as represented in Figure 1 (American Community Survey, 2022).

From these data points, women report higher rates of disability both in general and in target groups. Similarly, the New Jersey State Health Assessment reports that amongst all ages, the percentage of the female population below the poverty level is higher than that of the males at 10.6% and 8.7%, respectively. The cascading difficulties that render disabled women both at a higher population percentage than men and at a higher poverty rate suggest that there should be a focus not only on the physically disabled population as a whole but those who are the most unable to provide for themselves as well, regardless of the community.
For the percentage of the population with a disability the data reports 16.8% compared to that of the no-disability population reporting 8.8% in both males and females (American Community Survey, 2022). This data represents a common thread amongst populations with high rates of disability; which also tracks higher rates of poverty. Females represent the greater proportion of people with a physical disability in these statistics and the broad differentiator of gender greatly affects the percentage of people living in poverty, as well as those with a disability. While a 2% difference between the reported disabilities for men and women may not seem like a lot, its effects can be seen in other SES indicators, especially where people fall below the poverty line.
With the base understanding that the age group with the highest percentage of reported disabilities is 35-64, the American Community Survey then broadens the target sample by including the race factor, which is an important identifier in regards to socioeconomic challenge as the general classifier of “race” typically encompasses adversities that are not regularly reported in demographic analyses of regions population trends. Although the range for race-based data is a bit larger, spanning from those 18-64 years old, the data remains relevant. In New Jersey, within the age 18-64 range, the racial denominations with the highest number of reported disabilities are African Americans at 11.6% classified as disabled, and Native Americans at 10.6% classified as disabled. On the other hand, the race(s) with the lowest percentage of those classified as disabled is Asian at 3.73%, and White is second lowest at 8.34% (American Community Survey, 2022).
Concerning poverty status, the American Community Survey reports that the racial group with the largest population below the poverty level in New Jersey is White, a direct inverse to their ranking in regards to the percentage of the population classified as disabled, followed by African-American, then Native American, and Asian. Despite this, White people have the second lowest unemployment rate percentage, at 3.9%, with the highest being African Americans at 8.8% (American Community Survey, 2022), suggesting that despite their seeming advantage in the job market, those of the White demographic are struggling to find work that can provide living wages, which puts those with disabilities at further risk due to the evident limitations faced when seeking employment opportunities. Similarly, African Americans rank second to lowest in terms of per capita income, with Hispanics ranked lowest and the white demographic in the highest earning position. The poverty statistic is crucial in a discussion about the differences between communities in the state, as the counties with a higher population of a race that reports a high percentage below the poverty will then default to lower median income. Invariably, the county and people will be limited in their accessibility to public resources. From the percentages above, the most intriguing statistic is the White denomination having the highest population percentage below the poverty line followed by African Americans, but when it comes to employment status, the African-American cohort is the lowest followed by White despite having the highest per capita income. Although not a certified fact, the reason for the variance in the ranking of White people across three separate indicators could allude to the range of wealth and financial security within the race. On the other hand, the percentages of reported disabilities for African Americans and Native Americans coincide with employment status, as those with disabilities regularly find it more difficult to find secure and sustainable employment. In contrast, the data isn’t as linear for their White and Asian counterparts.
County Data Results
It is important to discuss both ends of the median income spectrum to understand the demographic challenges faced by those with physical disabilities in different counties. The counties with the highest median income are Salem, Hunterdon, and Morris, with a relatively large corporate-based population. The countries with the lowest median incomes are Passaic, Cumberland, and Essex. Their populations are considerably more diverse than Hunterdon and Morris with various occupations and income levels across demographics, which suggests a relationship between a larger medley in the job income strata accessibility and a wide range in diversity, which can both benefit and inconvenience those with disabilities.
New Jersey State Health Assessment Data shows that the counties with the highest per capita income are Hunterdon and Morris, whereas the counties with the lowest per capita income are Passaic and Cumberland. Reflective of this is their unemployment rates, of which Cumberland is one of the highest ranking in New Jersey at 7.2% unemployment whilst Morris is one of the lowest at 3.4% unemployment. The unemployment rates and per capita incomes are often indicators of the support counties receive from state and municipal governments, where lower percentages can often represent low funding for programs and resources for the physically disabled. Similarly, the more impoverished a county is, the more likely it is to receive less support. Cumberland County ranks highest in poverty amongst all ages at 15.3% whilst Morris is the lowest-ranking county at 4.1%. Most importantly, Cumberland has the third highest disability status at 15.2% whilst Morris has the second lowest at 8.9% (New Jersey Department of Health, 2024).
An analysis of the population density/diversity rating by county, based on 2022 U.S. Census Data was conducted by the William J. Huges Center for Public Policy and scored counties 1-10 on a Diversity Index (1 being the least amount of diversity, 10 being the most amount of diversity) and Least Diverse to Most Diverse. Cumberland, Passaic, and Essex counties are all identified with the “Most” diversity rating (Maurice, 2024).
For the following section, the percentages for each demographic are derived from their respective county and put in ratio with each other. The ratio provides insight on both the majority and minority of each county and is also particularly important in identifying who makes up the population of counties with high disability rates and those with low disabilities. The percentages have been rounded to the nearest tenth.
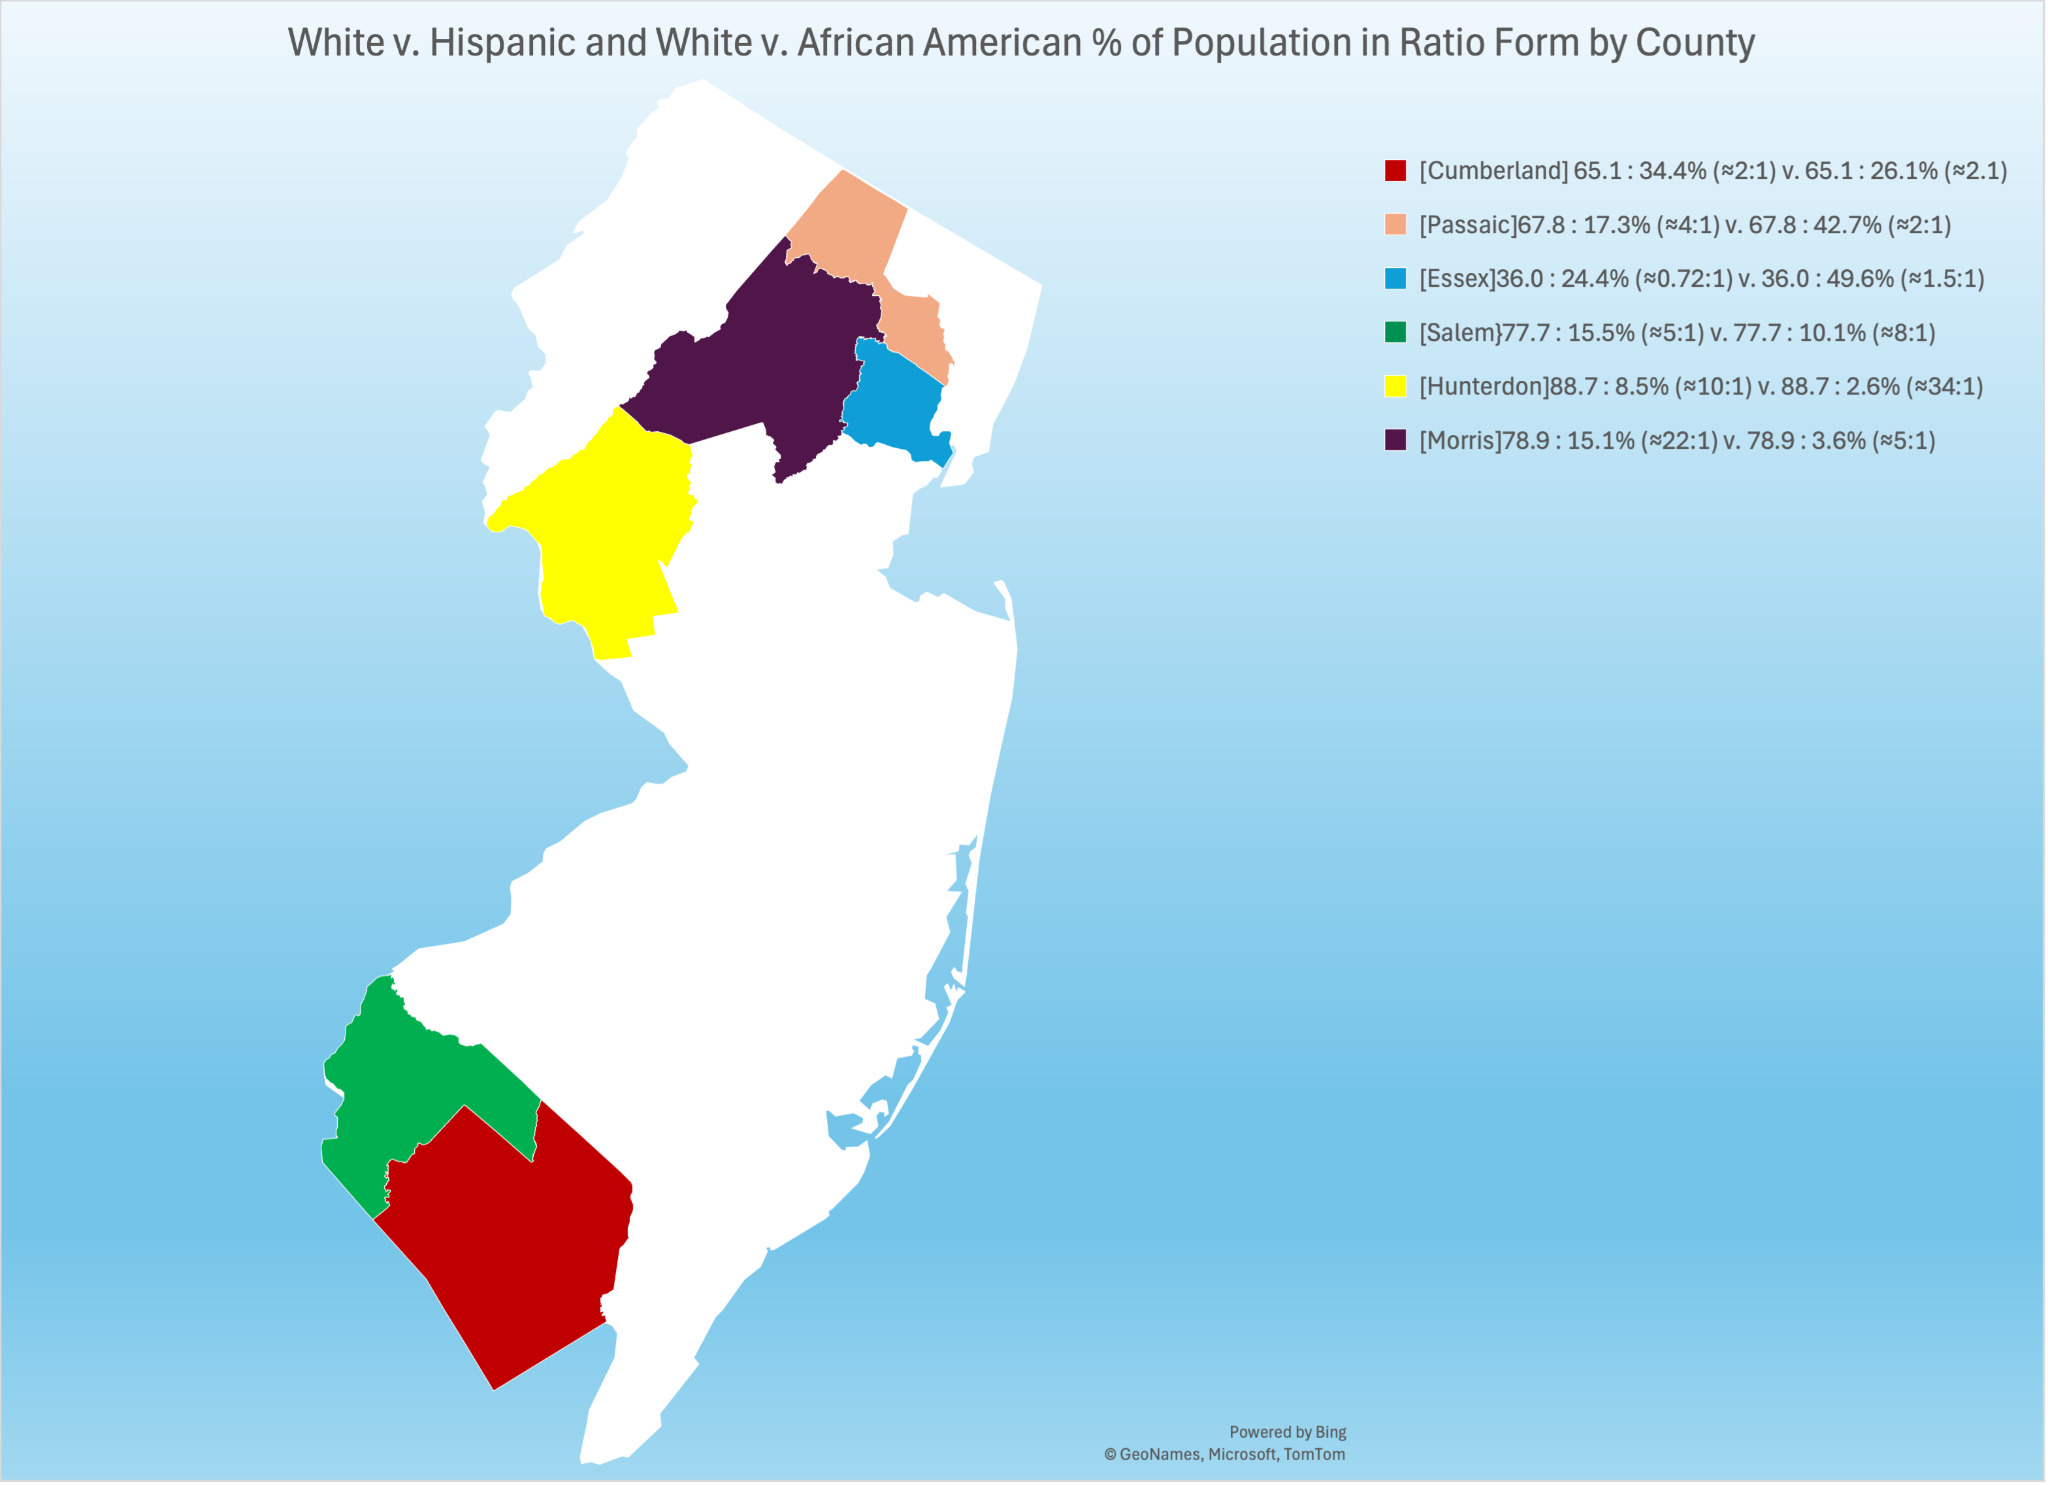
Cumberland County has a White-to-African American population ratio and a White-to-Hispanic population percentage ratio of 65.1:34.4 (approximately a 2:1 ratio for both). Passaic County has a White to African American Population Percentage ratio of 67.8:17.3 and a White-to-Hispanic population percentage of 67.8:42.7 (approximately 4:1 and 2:1, respectively.) Essex County has a White-to-African American Population percentage ratio of 36.0:49.6 and a White-to-Hispanic population percentage ratio of 36.0:24.4 (approximately 0.72:1 and 1.5:1, respectively) (Maurice, 2024). These diversity statistics are important to acknowledge regarding accessibility as certain demographics, such as Hispanic and African-American, often have a higher population in counties that have lower median incomes, implying that there is both less local and state funding for accessibility-based projects and institutions. Salem and Hunterdon County are classified as the “Least” Diverse counties whilst Morris County is classified as “Moderate-Least”. Salem County has a White-to-African American population percentage ratio of 77.7:15.5 and a White-to-Hispanic population percentage ratio of 77.7:10.1 (approximately 5:1 and 8:1, respectively). Hunterdon County has a White-to-African American population percentage ratio of 88.7:2.6 and a White-to-Hispanic population percentage ratio of 88.7:8.5 (approximately 34:1 and 10:1, respectively). Morris County has a White-to-African American population percentage ratio of 78.9:3.6 and a White-to-Hispanic population percentage ratio of 78.9:15.1 (approximately 22:1 and 5:1, respectively) (Maurice, 2024).

The Arc, a national resource for those with disabilities, creates spaces for New Jersey counties, including Essex, Salem, Cumberland, and Passaic. The foundation is funded primarily by donors, government grants, contracts, fees, and dues owed by local and state chapters. This is one example of a neutral program, providing the same resources despite the differing socioeconomic factors between the counties. However, more county-based programs are scarce, with the primary resource for each being the County Office for the Disabled. This means that the majority of organizations and groups dedicated to those with physical ailments are volunteer and donation-driven. Typically, in direct correspondence with the average income of each county, the amount of foundations, volunteers, and donations can vary erratically.
The American Community Survey estimates that the male population of 35-64 years in Cumberland County is 30,675 whilst the female population of that same age range is 28,190. Per the data based on gender denominations, Cumberland would be less predisposed to a population with a higher number of disabled people. Passaic County’s male population in the 35-64 year age range is 113,146 and the female population is 117,058, which, unlike Cumberland, predisposes them to both a larger population of disabled people due to a higher number of females, but also because of the large number of people in the 35-64 age range. Essex County’s male population in the 35-64 year age range is 171,811 and the female population is 204,121. Salem County’s male population in the 35-64 year age range is 14,609 and the female population is 14,856. Hunterdon County’s male population in the 35-64 year age range is 30,704 and the female population is 31,647. Morris County’s male population in the 35-64 year age range is 107,490 and the female population is 121,065 (American Community Survey, 2022). Despite having large populations in the 35-64 age range, Morris, Hunterdon, and Salem have a significantly smaller disabled population as opposed to the counties with lower median incomes. This is an indicator that income dominates access to public resources, and when combined with race, the socioeconomic barriers are further elevated.
Discussion and Conclusion
The data as mentioned above can be used to form an effective map of how the differing statuses within both the disabled and non-disabled communities can affect access to essential public resources. First, understanding the basic indicators of an underserved community includes looking at the average median income, as well as the poverty and employment statuses of the population. The first set of information that can be derived is the median income for people with disabilities, by county, and by race. For people with disabilities, it is evident that if you are a black female who lives in Cumberland County, you are far more likely to maintain a lower median income, with and without a family, as opposed to a white male with a disability living in Hunterdon county, because the employment rate and average median income are higher for Hunterdon’s SES indicators. As females in general have lower employment percentages, a county with a higher population of identifying physically disabled females, might be characterized by a lower median income or a higher poverty rate. This is dependent more on the racial denomination of the female population as the data already shows that more females report disability status than men. It is also no secret that the counties labeled as “Most Diverse” have lower median incomes than the counties labeled as “Least Diverse.” Of the sample group of counties, taken from both ends of the median income spectrum, the counties with the highest percentage of the population with a disability are Cumberland and Essex. Morris and Hunterdon County are among those reported to have the lowest percentage. Despite the cardinal differentiators of Cumberland and Essex (Cumberland being in South Jersey and Essex being in North Jersey), their populations still defined their resulting disability percentages. The data showed that both counties had high African-American and Hispanic populations, two out of the top three racial denominations classified as physically disabled. These are also two out of the top three racial denominations with the highest population percentages below the poverty line. Similarly, Cumberland and Essex counties are two of the highest-ranking counties in terms of poverty, with Cumberland being the highest-ranking county out of the 21 in New Jersey. Whilst many graphs and charts depict this data, they are not available in this research paper, however, they are all available publicly via the U.S. Census and the New Jersey State Health Assessment websites.
Conclusion
It is evident through the data and prior research that not enough is being done to provide for underserved communities. The data shown regarding the demographics of the different counties and the programs/government spending provided to them by both the state and federal governments provide a resounding answer to the research question. In counties that have higher poverty levels (Essex, Cumberland, Hunterdon, Morris) there is a clear lack of support for those with physical disabilities as compared to counties with higher incomes. In a larger scope, it can be said that those retaining the larger income are typical of the White demographic, whilst Latinos, African-Americans, and Native Americans field much lower average incomes. Hence, the places populated by lower-income residents become regarded as lower-income communities, often overlooked in government expenditure. By noticing trends in population status and well-being, it becomes clear which counties, racial denominations, sex, and income levels suffer the most from physical disability and lack of access to public resources. Despite a clear stagnant trend that perpetuates the same disadvantages for the same communities, not much has been done regarding provision in the public sector. Government spending needs to increase and stricter guidelines need to be put in place for the Americans with Disabilities Act to start doing more good for the people it was created to support.