


Introduction
The United States of America was founded on the basis of immigrants coming to a new country for a better life for themselves and their families, commonly known as the American Dream. A Student’s grade point average (GPA) is taken into consideration in many aspects of their lives. It is crucial in the determination of the colleges they get into, the jobs they can achieve, and their financial stability. According to the American Psychological Association (n.d.), socioeconomic status (SES) correlates with educational resources. It is evident that some members of our community have greater access to resources such as tutoring, translation services, reliable transportation, and internet connectivity, all resources that are obtainable with higher income.
An immigrant, according to the Migration Policy Institute (2023), refers to any foreign-born person with the intention to stay in a new country. Generational status shows one’s family distance from immigration. First-generation individuals are those who immigrated from a foreign country; Second-generation refers to their children born in the new country, third-generation to their grandchildren, and so on. The division of legality refers to the authorization of being present in a foreign country. This distinction shows terms such as illegal immigrants, referring to those without legal authorization, and naturalized citizens, who are lawful immigrants who have obtained citizenship through the legal process (Migration Policy Institute [MPI], 2023). All naturalized citizens are lawful immigrants; however, not all lawful immigrants are citizens. In the United States, individuals may be present lawfully under other circumstances, such as seeking asylum, being a permanent resident, or, for many, are considered twilight. Having Twilight status protects from deportation, but not the same benefits as permanent legal status, as stated by Penn State Social Science Research Institute (2023). For twilight statuses, there are programs such as the Deferred Action for Childhood Arrivals (DACA) and Temporary Protected Status (TPS), while limited legal rights are given, individuals tend to lack educational stability in these programs. Their limitations ultimately can impact their educational access, hindering their academic performance in the long run.
Legal Status and Educational Barriers
The legal status of a student and their family can significantly impact their access to educational opportunities through a combination of social and legal affairs. Immigrant students can face numerous barriers to their educational opportunities that may hinder academic performance. According to Western Washington University, language barriers may lead to a lack of understanding, minimal communication, and delayed development (2023). Developmental issues from a young age, especially regarding issues such as communication, can make it hard to advance relationships with peers, teachers, coaches, and other prominent figures for an adolescent. In addition to the linguistic challenges, undocumented and twilight immigrant students can have a shortfall of resources due to their legal classification. While programs such as DACA and TPS provide limited protections, they do not grant access to programs that provide federal funding. Additionally, many internships and scholarships have citizenship requirements for eligibility.
Cultural Background and Country of Origin
A student’s primary country of origin and personal cultural background can influence their academic outcomes for a variety of factors. Families from immigrant backgrounds tend to have a large emphasis on academic achievement, showing that education is a primary path to a high income in the future. In many cases, parents who previously experienced some form of economic or political hardship in their country of origin encourage their children to take full advantage of the educational opportunities in the United States; however, at the same time, the high pressure adds a burden to the adolescent. On the other hand, the additional pressure, discipline, and motivation can help contribute to a higher performance in school. According to Emily Greenman, an Assistant Professor of Sociology at Penn State University, the encouragement of immigrant families to alter academic behavior to be more successful than native-born students is known as the “immigrant paradox” (2013). A student’s cultural background can shape their mindset, motivations, and behaviors in ways that may contribute to their overall academic performance, even while systematic barriers are present.
Socioeconomic Status and Academic Performance
SES is one of the most influential factors in determining a student’s success. According to Zhen Liu, a Doctor of Sociology from Brown University, Higher SES can allow for more amenities to be used, such as tutors when struggling in a subject, preparation for college and standardized tests, more programs and extracurricular activities, and typically higher parental accountability and engagement (2018). Parental engagement is crucial for maintaining an academic plan for a student and the determination of their future. More involved parental engagement from parents leads to lower dropout rates among high schoolers (Liu, 2018). On the contrary, students from lower SES backgrounds can struggle to gain proper support systems, which can lead to gaps in preparation and performance. Liu (2018) emphasizes the importance of SES-based material support, while Greenman (2013) discusses cultural resilience, suggesting that both socioeconomic and motivational factors shape academic trajectories. These gaps signify that SES contributes to academic resource disparities that do not properly reflect the student’s full potential and ability, but rather unequal opportunities.
Generational Distance from Immigration
The number of generations a student’s family has spent in the United States can impact how successful they are in navigating their academic environment. First-generation students face the hardest and greatest number of barriers, including linguistic barriers, cultural and societal norms that do not coincide well with the American education system. Furthermore, second-generation students tend to demonstrate stronger academic performance according to Margarita Pivovarova, Ph.D in Economics (2019). This may stem from immigrant families’ motivational support, coupled with the absence of first-generation language barriers. Beyond second-generation students, third- or fourth-generation students may experience less influence from immigrant family expectations, which lessens their impact (Portes & Hao, 2004). As immigrant identity becomes more distant across generations, the sense of success and higher education decreases. While being integrated into the American culture and society brings forth another sense of academic stability. These shifts show that academic performance may depend on their distance from immigration experience.
Literature Gap and Research Purpose
Despite a large body of research regarding immigrant student history and academic achievement, two major gaps persisted throughout the literature review. Primarily, a population gap was identified. As around 27% of the total immigrant population, the United States of America receives annually is Latino (MPI, 2024). The current research focuses on both Latin and South American populations, overlooking the experiences of students from other cultures and ethnic backgrounds. This limits the generalizability of findings but also contributes to the inability to capture the full scope of the immigrant student diversity in the United States. Secondly, a knowledge gap was identified regarding the academic resources students lack and how legal status, cultural background, SES, and generational distance collectively impact educational performance. In many cases, previous research isolates these variables or negates them entirely rather than considering how they interact. Ultimately, leading to the research question, What is the relationship between a high school student’s GPA and their generational distance from immigration, as well as their country of origin, in the United States, with regard to socioeconomic status? Aiming to help develop a greater understanding of how all students are impacted by differing factors, and hoping to give all students equal opportunities in the education sector for their development.
Methodology
The research being conducted used a survey approach where participants were asked to engage in a questionnaire that drew demographical information regarding culture, socioeconomic status, resource availability, and language proficiency, among other personal preferences. A survey would allow for the collection of a large amount of data and easy distribution through social media. (Dillman et al., 2014). Statistics were gathered that varied between quantitative to qualitative data points, which together formed a mixed-method study. Questions about the participants’ generational status, projected income in quintiles, the participants’ country of origin, their parents’ household languages, and GPA were asked.
Justification of Method
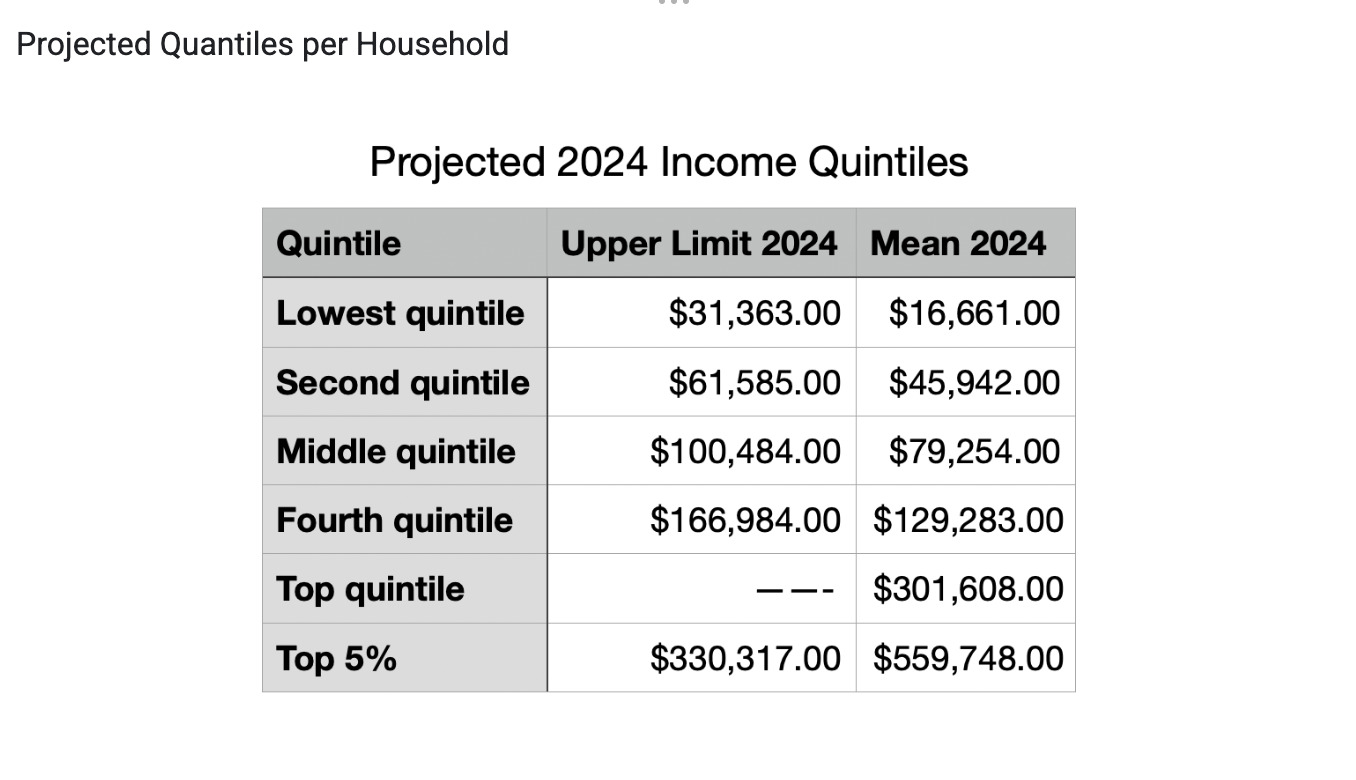
This wide variety of data points helped to answer the research question (What is the relationship between a high school student’s GPA and their generational distance from immigration, as well as their country of origin, in the United States, with regard to socioeconomic status?) since they demonstrated the disparities within different racial and cultural groups. This occurred when participants were asked them to state their culture, their parents’ cultural background (for the participant’s home situation), to estimate their household income, quintile bracket was created (Appendix A) using information gathered came from the Tax Policy Center which gather information from the Internal Revenue Service (IRS) for the year 2023 and augmented using information from the Bureau of Labor to account for annual inflation of 2.4%, and the participant’s grade point average (GPA). Combined, these statistics can demonstrate a correlation between cultures, whether it be ethnically or financially, and academic performance. With this data at hand, a conclusion of which group of students needs additional support and aid to become successful within high school and their higher education; therefore, a survey with quantitative and qualitative data points is the best method for collecting data on this issue.
Instruments Used
The use of a computer would allow for easy distribution of the survey and make it widespread, meaning it could be distributed to a population greater than just my school, which allowed us to collect a greater sample size. On the computer, a Google Forms survey was used that contained the survey questions. Additionally, the use of social media was a helpful aid in spreading the survey. The survey was posted to both Instagram and Snapchat, which have followers from across the state. Between the two platforms, around 800 people saw the survey link. Furthermore, this allowed people of various backgrounds and regions around the state to input their data into the survey, which can further aid in developing a solution to racial gaps within education.
Finally, within my school setting, Gmail and Schoology were utilized to send the survey to students within my school. The survey was distributed to some of the teachers in my building with a link to the survey and asked them to send said link to their students through Schoology. This then allowed for students of all ages and grade levels within high school to respond, further expanding the population of participants.
Procedure
Questions derived from a variety of different surveys, including the Bell Curve. The survey started with a list of demographic questions that allowed for a general understanding of the population, such as age, economic status, and cultural background. These questions could be answered by either a written response or a multiple-choice question. The survey was pilot-tested and reviewed by educators and peers before distribution to ensure clarity and accuracy.
No word limit is given; this allows participants to respond freely with no limitations. This is beneficial because it provides the study with variability in responses that would not be available if there had been multiple-choice answers with an “other” option. Questions such as “What is your Mother’s country of origin or primary cultural background?” and “What is your current weighted GPA on a 4.5 scale?” allow participants to go as in-depth as needed and provide unique responses that can help the sampled population grow in diversity. In turn, this will allow for an analysis of cultures and backgrounds that may be discriminated against, but have typically shown no inequality in previous studies. On the other hand, the multiple choice questions give between four and five responses. This allows for a precise measurement of data. By limiting the number of options participants have to choose from, data points can be gathered and piled into numerical groups, such as income asked by “Based on the following projected income quantiles for 2024, which combined income quintile would your household fall under?”, and yes/no questions asked by “Do you feel that you have access to academic support inside and outside of school?” and “Do you think your cultural/generational background has an impact on your academic performance?”. This allows for straightforward responses that can be used as starting points for analyzing data. However, each multiple-choice question has a follow-up that asks, “If yes, based on the previous question, please elaborate.” This then allows a more in-depth response based on the nature of the previous question.
Ethical Considerations
Due to the survey requiring human participation, multiple ethics checkpoints need to be taken into consideration. First, there is informed consent for adults and the assent forms for minors, which require parental consent. This requires that the participants are fully informed about the purpose, procedures, risks, and benefits of the study. To fulfill this requirement, the second, third, and fourth pages of the survey (dependent on the age of the participant) outline the purpose of my survey, the methodology regarding the survey, the risks involved, and any benefits to the participants themselves.
Next, anonymity and confidentiality had to be taken into consideration. To keep participants anonymous and their information confidential, the survey did not ask for any identifying information, such as name or email, and did not share any survey data with any outside parties. Additionally, to account for the emotional well-being of the participants, questions were not asked that would invoke any form of stress or memory of a traumatic experience.
Before distributing the survey, obtaining ethical approval was necessary to ensure participant protection and research integrity. Since the study involved human participants, school approval was required so that it complied with institutional policies regarding data collection. The approval of the Institutional Review Board (IRB) allowed the research to be conducted ethically with minimal concern for mental and emotional considerations for participation in my survey. Furthermore, parental consent and minor assent were secured for participants under 18 to ensure voluntary participation, as seen in pages one through four of the survey. Additionally, all approval documents and consent forms were recorded to maintain compliance. Unauthorized data collection would compromise the study’s validity and ethics, so any concerns raised during the ethics review were addressed through revisions before the survey was administered. These measures upheld research credibility, minimized harm, and ensured the study met ethical standards.
Results & Analysis
Quantitative Results
At the end of the study, the qualitative analysis was based on 75 student responses for self-reported data regarding unweighted GPA, generational status, SES, and country of origin. While 77 responses were received, three of the answers were invalidated due to a lack of information provided, incorrectly responding to the question, which further limited the population size. To determine whether there were statistically significant differences in GPA across the groups, statistical tests were conducted using generational distance and SES as their independent variables.
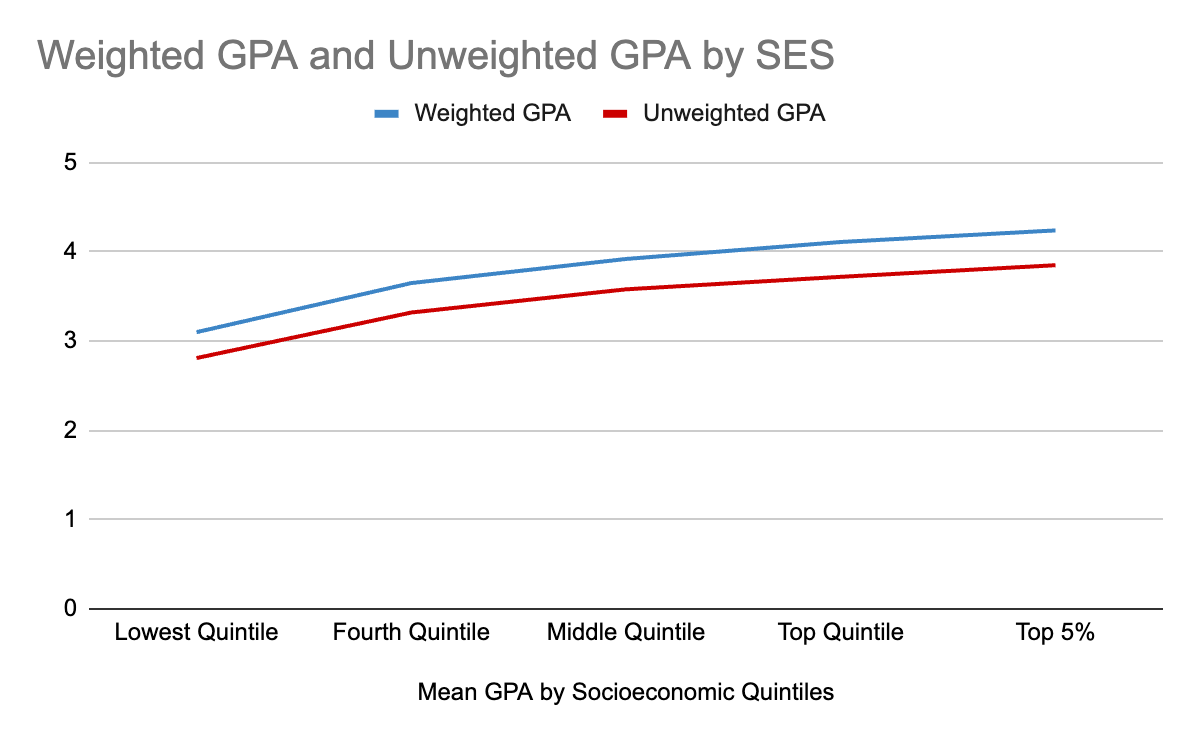
Of the tests conducted, A one-way analysis of variance (ANOVA) test was used to determine if there was a significant difference between the participants who were researched. Socioeconomic status demonstrated a strong connection to the academic performance of a student. ANOVA showed a highly significant relationship between the two factors, with degrees of freedom being established. Between-group degrees of freedom have six income categories minus one. Within-group differences had 75 valid participants minus six. The F-test results show (F = 9.16, p < 0.001). This indicates that income is correlated with a higher GPA. To further analyze this relationship, a Spearman correlation study was conducted, which resulted in a statistically significant positive correlation (ρ = .42, p = .024). The mean averages displayed (Figure 1) show a positive correlation. These findings support the previous existing research that linked SES and increased access to academic resources, parental engagement, and ultimately, academic achievement.

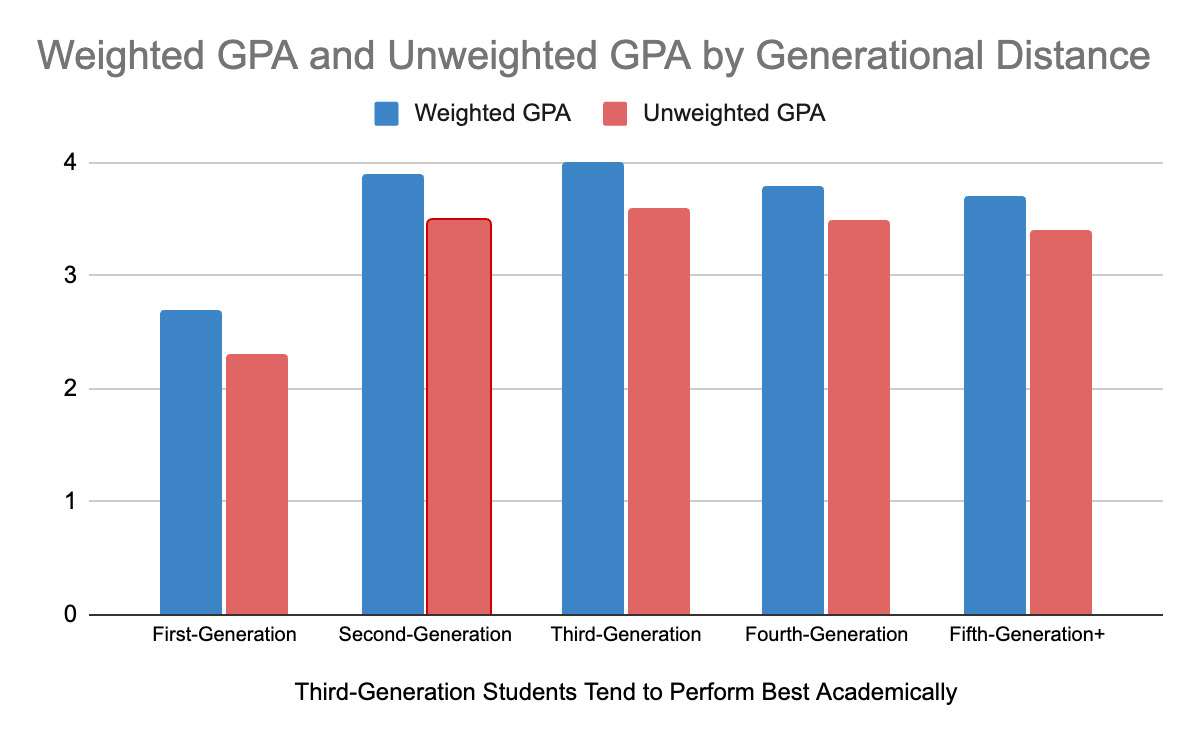
An ANOVA test was also conducted regarding GPA and the generational distance to determine any correlation between the two variables. First generation had a weighted average of (2.3) and an unweighted average of (2.7. Second-generation students had a weighted average of (3.9) and an unweighted average of (3.5). Third generation weighted average (4.0) and unweighted (3.6). Fourth generation (3.8) weighted and (3.4) unweighted. And Fifth generation onward (3.7) weighted and (3.4) unweighted. The data shown is graphed in (Figure 2). Degrees of freedom were established for this test, five generational groups minus one for the between-groups. Additionally, 75 participants minus five groups. The F-Test results show (F = 2.83, p = 0.031). Second-generation students reported higher GPAs than both first and fourth, and fifth-generation onward; however, third-generation students reported the highest GPA compared to the rest of the generations.
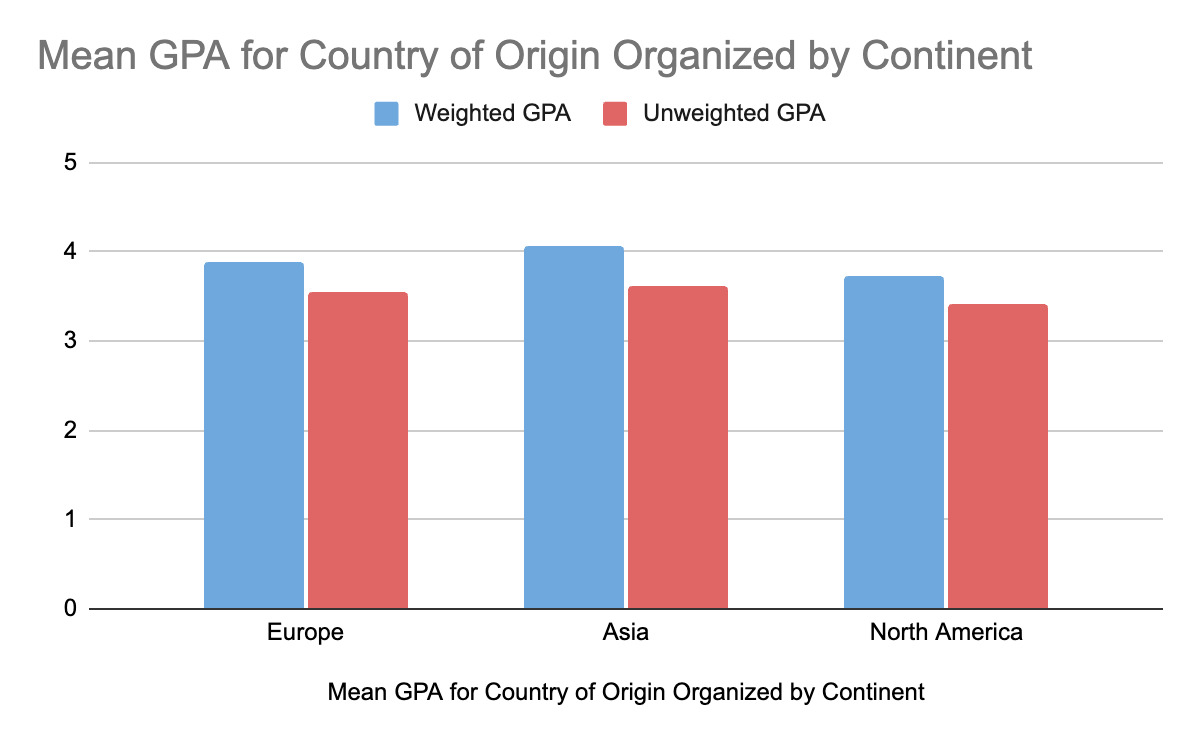
On the contrary, data regarding the country of origin was organized on a continental basis. An ANOVA test comparing GPA and country of origin established on a continental basis did display statistically significant results (F = 6.89, p = .001), though the small sample sizes limit broader generalizability. Europe (n = 39) and North America (n = 32) had the majority of the responses, while Asia (n = 5), South America (n = 1), and Australia (n = 1) were less represented in the dataset. Mean GPAs varied notably within the continents. Asia had the highest weighted GPA (4.15) and unweighted GPA (3.75), followed by Europe with a (4.09) weighted and (3.65) unweighted, and last North America with a (3.71) weighted and a (3.32) unweighted. The data was graphed, including the three continents with the largest sampling of participants (Figure 3). Both South America and Australia, each only were represented by only one participant, who reported lower individual GPAs. Further research in the field should be conducted with larger population samples to strengthen these observations.
Quantitative Limitations
Several limitations affect the quantitative findings. First, despite the sufficient population sampling size, the distribution of the participants and their continental basis was uneven.. While all were included in the ANOVA statistical analysis with groups involving an n = 1 can lack reliability and should be seen with caution when attempting to generalize the data. The findings may reflect sampling bias, limiting the generalizability of the results to the broader immigrant student population. It is also important to note that correlation does not equal causation, as doing so would require a strong positive correlation over a duration of time that has consistent research backing it up, according to JMP Statistics (2025). Future research would benefit from gathering a more balanced participation group across continents.
Second, all the data and information received from the questionnaire were self-reported, allowing for potential inaccuracies in GPA or demographic responses. Additionally, variations in their self-assessment or reports could introduce measurement bias.
Third, the findings are limited in generalizability to the broader United States high school population. The sample overrepresents students from North America and Europe, while Africa and South America are underrepresented. Future studies should use stratified sampling to ensure balanced participation.
Despite the limitations, there is strong evidence supported by the study that generational status and socioeconomic status significantly influence GPA. The significant differences observed across continents of origin may call for an important starting point for deepening our understanding of how our cultural background may interact with our educational achievement.
Qualitative Results
The qualitative responses gathered from the questionnaire derived from open-ended survey questions provided further insight into personal academic experiences from students across different cultural, socioeconomic, and ethnic backgrounds.
First, access to academic support and resources was a recurring theme. Many students reported having access to academic resources and support, such as from tutors, teachers, or family members, when they felt that they were struggling with their coursework. Continental basis did have an impact on the type of support they received, European participants tended to have more mentions of academic resources such as tutoring, North American students had themes of mental health services and extracurriculars, and Asian students tended to have a higher emphasis on parental engagement. Responses repeatedly emphasized the ability to seek additional support when needed, suggesting that support systems are in place and are widely available across the sample population.
Secondly, parental engagement and cultural involvement were evident throughout the data. Students from immigrant backgrounds referenced cultural values often, which discussed a strong work ethic, perseverance despite challenges, and ultimately the importance of academic achievement. First and second generation students tended to focus more on cultural expectations, while third, fourth, and fifth onward had more mentions of peer and societal expectations. These expectations appeared to shape students’ attitudes toward their academic planning and future.
Multiple students indicated having confidence in asking teachers and family members, implying there is an emotional factor in maintaining academic performance. While a smaller number of responses mentioned mental health resources, such as access to counselors and therapy, when they were struggling. The availability of different forms of resources made it clear that different struggles require a broader range of tools to contribute to academic success.
Overall, the qualitative data works in conjunction with the quantitative data to highlight the roles of family support, cultural values, and access to academic resources in shaping a student’s ability to achieve academically across different backgrounds.
Qualitative Limitations
There are several limitations regarding the interpretation of the qualitative data. First, open-ended questions had varying response lengths and levels of detail. Additionally, while qualitative trends were analyzed based on demographic groups (SES, generational status, and country of origin), some subgroups had small sample sizes, such as certain continents and extremely low SES categories. This could have had an impact on determining the broader patterns across different backgrounds.
Furthermore, the qualitative responses were self-reported, introducing self-bias when participating in research studies. Student interpretations of their own personal and academic experiences are subjective and open to personal interpretation, which may be inaccurate or augmented by personal bias, or level of awareness. This introduces potential researcher bias despite the attempt to minimize this with anonymity.
Despite the limitations, the qualitative findings offered a valuable insight into the quantitative results, working together to deep dive into the roles of family support, cultural values, and access to resources in our communities, and the ability to provide more access to resources, maximizing educational opportunities.
Discussion
The results of this study indicate that both generational status and socioeconomic status play a significant role in influencing a student’s GPA. Third-generation students tended to report the highest academic performance, with Second-generation students following, suggesting that proximity to immigration may provide unique motivations for increased performance due to a lack of experiencing the immigration barriers that first-generation students face. Similarly, students from higher-income backgrounds demonstrated stronger academic success, which highlights the role of finances in expanding education opportunities such as tutoring and access to other academic support services. An analysis by continent of origin also revealed differences in GPA. Students from Asia and Europe tended to achieve higher GPA averages compared to the other groups, although the generalizability of this data should be interpreted with caution due to the small sample size. South America and Australia, specifically, were each represented by a single respondent, limiting the generalizability of continental comparisons. Nevertheless, trends observed can serve as a starting point for considering how other cultural and geographical factors can have an impact on educational experiences. The qualitative responses added depth to these findings by highlighting the use of familial support systems, teacher accessibility, and cultural expectations regarding education planning and performance. Students from higher socioeconomic backgrounds mainly relied on academic support outside of school. While First, Second, and Third-generation students relied more on family support as well as on in-school resources.
The study shows that academic achievement is a complex comprehension issue regarding social, economic, and cultural influences rather than an individual cause alone. Socioeconomic status, family engagement, and access to institutional resources are all factors that contribute to the building of a long-term academic plan that will lead to educational success. Future research can be built on the implications of these findings, such as generational distance in a new country, increased resource availability, and incorporating a greater population when sampling. These findings create important implications for addressing educational disparities in the United States. Attempting to understand that generational status, SES background, and culture can all influence academic achievement, educational institutions must design resources and courses of action that support students from all backgrounds. Efforts to equalize academic opportunities should include expanding access to tutoring, mental health resources, and extracurricular activities, and culturally responsive efforts for all students. By acknowledging these factors, the education system can take steps and measures to ensure that every student, regardless of their background, can have the foundation to develop and achieve their full potential.