
Introduction
Online hate speech—“speech or writing that attacks or threatens a particular group of people, especially on the basis of race, religion, or sexual orientation” (Oxford University Press, n.d.)—has become a growing concern on social media. The ADL in 2024 reported that “22% of Americans experienced severe harassment on social media in the past 12 months, an increase from 18% in 2023” (ADL 2024).
Most prior research on hate speech detection has focused on short-term snapshots. For example, Mondale et al. (2018) sampled tweets from only 2014–2015, and Salminen et al. (2018) gathered data from a three-month window in 2017. Yet longitudinal analyses could offer critical insights into the driving forces behind the rise of hate, informing more informed interventions to mitigate its spread. For instance, Klinkhale (2022) analyzed ~50,000 tweets from before, during, and after the January 6th U.S. Capitol storming, calling to attention how time and events can affect comments on social media.
Using a longitudinal method of hate classification in a broader sense could provide reliable trends, given the fast-changing nature of online discourse and the possibility that external factors, such as political events or changes in platform policies, may impact the dynamics of hate speech over time. Analyzing longer term trends could help us understand the history and greater underlying factors of this information that could fluctuate in the short run. (Ziegler & Gertz, 2023). This helps researchers and platforms develop more stable strategies for addressing online hate
One potential factor that can be better studied by longitudinal study is usage data—how many people are on Twitter in a given time period. Larger groups tend to suppress conflicting opinions, fostering hate as people cling to their in-groups and reject “outsiders” (Turbic & Galesic, 2023). Accordingly, Twitter’s user base grew from 305M in 2015 to 353M in 2020.
We’ve seen how hate has expanded across the online world. Kim et al. (2021) discovered that users were more likely to employ toxic language if exposed to toxic remarks. In Anspach (2020), participants who were racially resentful after seeing a racist tweet from President Donald Trump were more likely to "describe African-Americans in starkly stereotypical and negative language (pg 1). As Twitter’s user base grows, more people may engage with hateful rhetoric, potentially amplifying its reach.
This study uses Twitter data from 2015 to 2020 to examine whether hate speech increases as platform usage increases. We use machine learning models to classify tweets into hate speech, offensive language, or neutral text, and then assess whether hate speech prevalence correlates with user numbers.
Given the resource constraints of a high school research environment, simpler models were used. While less precise than deep learning, these tools are sufficient to explore trends and encourage more rigorous future work.
This work serves as a proof of concept, demonstrating longitudinal hate speech analysis and highlighting critical areas for future research with more sophisticated methodological approaches. After results are discussed, the study will briefly discuss why it is still so imperative that we should research hate-speech at a macroscopic level. The goal is to spark further discussion and research in the field of long-term online hate speech trends, but due to the limitations, the study does not aim to make detailed claims.
This study asks: is the number of people on Twitter in a given year correlated with that year’s proportion of hate speech? If there’s a noticeable association between these two values, then we may declare a correlation between them.
(Note: Twitter will be referred to as “Twitter” throughout, as our data predates its rebranding to X.)
Methods
Model
This study used a publicly available machine learning tutorial from Simplilearn as the foundation for the classification model. The training dataset consisted of 24,783 labeled tweets sampled randomly from 2015–2020 and categorized into three classes: hate speech (0), offensive language (1), and neutral speech (2).
Preprocessing And Feature Extraction
Tweets were preprocessed by lowercasing, removing punctuation, stopwords, and URLs using NLTK. Count Vectorization was used to extract unigram, bigram, and trigram features, representing each tweet as a vector of word frequencies. Although TF-IDF was tested, it overfit the offensive language class, so Count Vectorization was used instead. As the database is heavily skewed towards class 1 (offensive language), we incorporated class balancing into our models.
Modeling
Our first step was determining if a tweet was hateful or not. For that, we used a Logistic Regression model, where we noted class 0 as 1 and all else as 0.
From there, we combined this with a random forest. This random forest, using 100 decision trees, was used as a multimodal classifier, with classes 0 (hate), 1(offensive) and 2(normal).
Both models used balanced class weight. For the RandomForest, we set n_estimators to 200, min_samples_split to 2, min_samples_leaf and 1, max_depth to 20. These steps optimized the F1-score without overrepresenting hate speech.
Evaluation
The model was evaluated using accuracy, precision, recall, and F1-score. The primary focus was on understanding how well the model could detect hate speech, especially in terms of recall.
Dataset
The twitter-year-splits (KaiNylund, HuggingFace) was used to compare hate speech proportions year over year from 2015 to 2020. Each yearly dataset contains ~90,000–100,000 randomly sampled tweets from the Internet Archive’s Twitter Stream Grab.
Steps
The classification process was automated using a Python script that iteratively processed tweets in batches of 500. Each tweet was transformed using CountVectorizer, then passed through both trained classifiers. The model returned predictions for each tweet: 0 for hate speech, 1 for offensive language, and 2 for neutral content.
The classification outputs were compiled into a DataFrame for each year. A custom function (scorecalc) aggregated the number of tweets in each class, allowing us to compute the annual proportions of hate, offensive, and neutral speech. These proportions were then compared against monthly active Twitter user counts to assess correlation.
The full codebase, including preprocessing and classification logic, is available here for replication and review.
The repository for this project can be found here.
Results
In this section, we present the numerical findings from our analysis of Twitter data spanning from 2015 to 2020. Our study aimed to investigate the prevalence of hate speech, offensive language, and neutral speech over time and how these trends correlate with platform usage.
The Decision Tree classifier achieved an overall accuracy of 88% on the test set. For offensive language, precision for detection is 0.96 and recall is 0.86, ending up with an f-1 score of 0.91, suggesting a heavily strong model. However, the model struggled to detect hate speech, achieving precision of 0.41 and an f1-score of 0.53 for this class.
Yearly Distribution of Speech Categories
The table below summarizes the number of tweets classified as hate speech (class 0), offensive language (class 1), and neutral speech (class 2) for each year from 2015 to 2020. The proportion of each category has also been calculated- how much of that specific year is hate speech, how much is offensive, etc.
Hate speech steadily increased from 0.53% in 2015 to 1.02% in 2020. Offensive language rose more modestly, while neutral content declined slightly from 90% to 88%.
Linear Regression Model
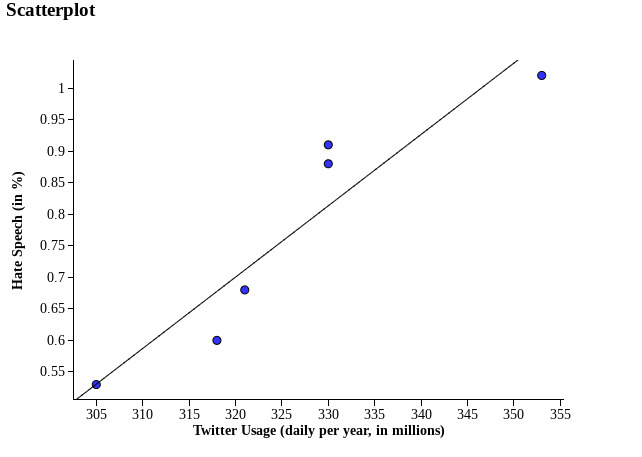
Each point on the scatterplot below represents ~100K tweets from a given year. The equation for the linear regression model relating this sample’s Twitter Usage and Hate Speech is where x = Monthly Twitter Usage in a specific year (in millions), where y = Proportion of all tweets in a given year being hate speech.
Plotting hate speech against Twitter usage reveals a strong linear relationship (r = 0.935), with residuals showing low variation (SD = 0.077). According to the model, as a million people join Twitter, the proportion of hate speech is projected to rise by 0.0113%.
Confidence Intervals for Regression Coefficients
We are 95% confident that the true slope relating Twitter Usage and Hate Speech is captured in the interval [0.004, 0.018]. As 0 is not contained within the 95% confident interval, we have convincing evidence of a positive linear association relating Twitter Usage and the proportion of Hate Speech.
Regression Model Diagnostics
The adjusted R-squared value is 0.875, meaning that the LSRL relating Hate Speech and Twitter Usage accounts for 87.5% of the variation in Hate Speech.
Taking an F-test, we calculated our F-statistic as 28.05, giving us a p-value of 0.006 The F-test shows the overall regression model is statistically significant at the 99% confidence level.
The dataset used represents a simple random sample of tweets grouped by year, which provides insights into longitudinal trends on Twitter during that time frame. Keep in mind that with only 6 data points, much of these model diagnostics could be skewed, flawed, or otherwise changed. Thus, besides the general trend, further claims won’t be made about this dataset.
These results align with broader research on the potential link between online platform usage and the prevalence of harmful content like hate speech. As user bases expand, the increased volume of discourse may contribute to the proliferation of toxic language, potentially due to reduced moderation, algorithmic amplification, and the spread of extremist views.
Discussion
The results of our analysis reveal significant trends in hate speech, offensive language, and neutral speech on Twitter from 2015 to 2020, highlighting both encouraging findings and persistent challenges in detecting harmful content. However, the limitations greatly impeded the scope of our project.
Trends in Speech Categories
The data shows a steady increase in hate speech, effectively doubling over the six-year period as it rose from 0.53% in 2015 to 1.02% in 2020. This trend aligns with broader societal concerns about the growing prevalence of harmful discourse online, particularly in an era of heightened political polarization and social tension. Offensive language also exhibited a moderate increase, suggesting a parallel rise in hostile but non-hateful interactions. Meanwhile, neutral speech saw a slight decline, indicating a negative shift in the overall tone of online discourse.
Model Performance Evaluation
The Decision Tree performed well, with 88% accuracy and strong offensive language detection (precision: 0.96, recall: 0.86). However, the model’s struggle with detecting hate speech, reflected by a precision of 0.41 and an F1-score of 0.53, underscoring how hate speech’s subtle, context-specific nature challenges basic machine learning models.
A big limitation of this study was the knowledge and technology at its disposal. As a high schooler working from an office laptop, deep learning was not feasible to understand and learn within the time of this research paper, nor was testing larger amounts of data.
Reflecting this study’s purpose as a proof of concept, we highly recommend that for future reports on this topic, a higher-accuracy model be tested on this data.
Correlation Analysis and Significance Testing
The linear regression analysis (r² = 87.46%, r = 0.933) between hate speech prevalence and Twitter usage data suggests a strong positive correlation. As Twitter usage increases, so does the proportion of hate speech. This relationship points to the potential amplification effect of social media: larger user bases may facilitate the spread of harmful content, either through direct propagation or algorithmic promotion. These findings emphasize the importance of platform-level interventions, such as improved content moderation policies and algorithm transparency, to mitigate the spread of hate speech as platforms grow.
As our slope’s 95% confidence interval of [0.004, 0.018] is greater than 0, we have convincing evidence of an association between hate speech prevalence and Twitter usage rates.
Data Collection
As stated previously, data collection proved difficult in this project. Due to Elon Musk’s acquisition of Twitter, tweet scraping and stream grabbing post-2023 wasn’t possible. Thus, we can only look at historical data before Twitter was acquired. Inherently, it means the scope of our subject (and of most Twitter research) is limited to pre-Musk acquisition. The main source of unfiltered Tweets is the Internet Archive, but due to large file sizes and lack of suitable technology, we weren’t able to directly sample from the source, instead basing our work off of kai-nylud’s dataset, which is only stratified into years, making statistical analysis difficult.
Extrapolating to the Modern Day
Even prior to Elon Musk’s acquisition of Twitter, online hate was already linked to real-world violence.
The 2019 Christchurch mosque shooting was livestreamed on Facebook and preceded by a sharp rise in Islamophobic content on New Zealand social media. A Netsafe survey found that nearly half of Muslim respondents had been personally targeted online in the 12 months prior (Crothers & O’Brien, 2020). This climate of normalized online hate likely contributed to the shooter’s decision to publicize his attack—revealing that hateful content had found a receptive and emboldened audience long before the attack itself.
For one, it foreshadowed what was to eventually be the normalization of hateful content on social platforms. But more importantly, it implies the audience for hate on social media that had finally solidified. In the months leading up to the attack, New Zealand social media saw a sharp rise in Islamophobic content. In a Netsafe survey gathering data about online hate speech around the same time as the Christchurch shooting, half of the Muslim respondents said they were personally targeted with online hate in the last 12 months (Crothers & O’Brien, 2020). The Christchurch attack emerged from an online culture where Islamophobia was already deeply entrenched.
Similarly, the January 6th Capitol riot was seeded in part by months of online disinformation and “fighting words” spread through social media, fostering a “patriot vs. enemy” group dynamic. Ofra Kline (2025) argues Twitter amplified Trump’s call for violence and helped white nationalists publicly plan for January 6th.
This context helps explain the strong positive correlation found in this study: as user engagement increases, the scale and visibility of hate speech do as well. High-profile hate content no longer remains fringe when the network itself is designed for virality and mass exposure.
Understanding the rise of hate speech from 2015 to 2020 is also critical in order to recognize the systemic risk platforms like Twitter now pose under deregulated moderation. Elon Musk’s 2022 acquisition of Twitter marked a turning point: thousands of content moderation staff were laid off, many previously banned accounts—including known white nationalists and conspiracy theorists—were reinstated, and trust and safety teams were downsized (ADL, 2023).
A team of USC computer scientists (Hickey et al., 2023) saw that the proportion of hate-flagged words in already hate-flagged posts jumped from around 0.001 to 0.003, and the daily average overall use of hate keywords on Twitter nearly doubled from ~40,000 hateful tweets a day to almost 80,000. And this all happened in the span of 3 months: matching the long-term trend seen in our 2015–2020 data.
When previously banned users were reinstated under Musk’s leadership, many felt emboldened by the absence of strict moderation. This shift likely contributed to the increase in hate speech observed in the Cohen study. As more users engage, hateful content becomes more visible, normalized, and algorithmically rewarded. People who previously withheld hateful views may now feel safe posting openly in the absence of moderation.
So why does a longitudinal study of behavior that happened eras beforehand still hold merit in today’s vastly different internet landscape?
Our results suggest that platform scale and content harm are not independent. As Twitter grew in users, it also became a larger host for toxic discourse—especially when hate speech was not consistently moderated. This makes the post-2022 rollback of moderation policies under Elon Musk not just controversial, but statistically dangerous. If hate speech already doubled from 2015 to 2020 with moderation in place, we must expect a steeper rise in environments with less oversight and more algorithmic amplification.
The normalization of hate on social media is now reflected in statements by high-profile political figures. Argentine President Javier Milei has called opponents “human excrement” and labeled the pope a “filthy leftist,” while the White House Instagram openly posts content titled “Deportation ASMR.” While such views have long existed and hidden, hate speech now circulates freely across platforms like X, Facebook, and YouTube, seeping into the mainstream and gradually desensitizing audiences. Now, even professional voices are not afraid to temper their rhetoric.
Conclusion
This study found a strong and statistically significant correlation (r = 0.933) between the rise in Twitter’s user base and the proportion of hate speech from 2015 to 2020. While not proving causation, the strength of this association suggests a consistent trend: as Twitter grew, so did the prevalence of hate speech.
That trend occurred even when moderation systems were still in place. With the rollback of these systems post-2022, it becomes even more urgent to understand how user growth can fuel harmful discourse. If hate speech doubled during a time of regulation, a platform with less oversight and more polarizing figures could see a steeper rise.
Longitudinal studies like this one help contextualize the exponential growth in hate speech. If Christchurch and January 6 reflect how online hate, even when moderated, can translate into violence, it’s even more imperative we continue to research long term trends when hate speech is now unmoderated.
Implications for Future Work
This research highlights important directions for future work in long-term hate speech analysis. For one, more advanced models should be utilized for studies like this. Basic models identified a trend, but more precision is needed for stronger claims.
A major barrier was the limited availability of historical Twitter data. Future researchers should prioritize expanding datasets beyond 2015–2020, and efforts should be made to archive more granular, long-term Twitter data before and after Musk’s acquisition, such as from the Twitter Stream Grab.
Cross-platform analysis is also essential. With long-term data, researchers could compare hate speech trends across platforms like Reddit, YouTube, and Twitter to identify where the biggest increases occurred. Investigating the real-world impacts of online hate speech—such as its influence on social behavior and public discourse—can bridge the gap between technical findings and societal needs. Future researchers should explore long term Twitter trends so we can gain a better understanding of hate speech, eventually decreasing its prevalence online.
Acknowledgments
I would like to thank Dr. Joe Xiao for substantial help with formulating this topic, finding the dataset, and helping with the communication of data through the paper. He was instrumental in shaping the project.
I’d also like to acknowledge Simplilearn for sourcing a tutorial on machine learning algorithms that I was able to derive my code from.