Introduction
Imagine arriving in a classroom where you do not speak the language, yet you are expected to learn, converse, and make friends in that language. For over 130,000 K-12 students in Washington State, this is a daily reality (Learning English in Washington Schools: What Families Should Know, 2024). English Language Learner (ELL) programs are designed to bridge this gap, but their success varies widely. In King County, graduation rates from ELL programs differ greatly across schools, indicating that the program has varying effectiveness. Understanding what drives these differences allows us to find ways to improve the educational outcomes of English Learners (ELs). This study aims to answer the question: what factors affect ELL program graduation rates and why? The results can help school administrators and policymakers identify areas of need and target such issues in ELL programs to create equitable opportunities for ELs to succeed.
A recent paper by Diane Rodriguez et al., “Factors that Challenge English Learners and Increase Their Dropout Rates,” reviewed existing literature on the underperformance of ELs and indicated that the main impediments are social and structural barriers, including the fear of failing academically, lack of teacher understanding for students needs, and limited access to social, political, and economic resources and influence. The paper then presented data and recommendations from a survey of New York City high school educators on the challenges ELs face in advancing through school and earning a diploma. However, while this paper offers valuable insights through interviews and surveys, it relies on data exclusively from New York City public high schools, and its findings might not be generalizable to other regions.
Another study by Karen D. Thompson, titled “English Learners’ Time to Reclassification: An Analysis,” examined how long it takes ELs to transition out of ELL programs, referred to as reclassification. This paper used statistical methods to analyze data from the Los Angeles Unified School District and found factors such as initial language proficiency, socioeconomic background, and district-specific policies play a role in reclassification rates. Thompson’s work emphasizes the importance of early enrollment, especially for beginning ELs, and consistent criteria for reclassification to make sure EL students progress equitably. While this paper provides critical insights into the factors that influence how long students stay in ELL programs, it does not explore strategies to improve program effectiveness or outcomes.
These limitations motivated us to conduct a broader study focused on all public schools in King County, using statistical models to identify key factors influencing English Language Learner (ELL) program outcomes, with a focus on actionable solutions. By incorporating a larger dataset from diverse schools in King County and using logistic regression to identify significant predictors of ELL success, our research aims to offer data-driven and comprehensive recommendations for improving ELL graduation rates. We believe this approach will provide more practical, targeted solutions that can be applied to school districts.
Materials and Methods
Materials
The findings of this study are based on data from three Washington State Report Cards for the 2022-2023 academic school year, provided by the Comprehensive Education Data and Research Systems (CEDARS, 2017). In total, we analyzed data from 464 schools across 18 school districts, representing roughly 80 zip codes. These schools included 285 elementary schools, 10 K-8 schools, 91 middle schools, 6 6-12 schools, and 72 high schools. The first dataset, “Report Card Enrollment,” details ELL enrollment numbers in all schools across Washington, including each school’s zip code and school level (elementary, middle, and high school). The second dataset, “Report Card English Learner Assessment Data,” provides information on the graduation rates of ELs from their programs. We used the graduation rate percentages from the “MetStandardLabel” column, which indicates whether students have met the proficiency standards across four key areas—speaking, listening, reading, and writing—via the WIDAACC assessment. Students who meet these standards are considered proficient and transition out of the ELL program (Report Card - Washington State Report Card, 2024).
The third dataset, “Report Card Student Access to Teachers,” outlines student access to teachers, categorized by their qualifications within the ELL program. These qualifications include distinctions between inexperienced and experienced teachers, limited-certificated and fully-certificated teachers, and those teaching in-field versus out-of-field (OSPI, 2024). Due to data privacy measures such as the “N<10 Count Protected” policy, which restricts the reporting of statistics for small groups, the analysis used district-level data as a proxy for school-level teacher qualification data. This approach was taken to maintain the accuracy and reliability of the data; however, this could potentially obscure the variability within individual schools, thus limiting the granularity of the analysis. In addition, income data, specifically median income by zip code, was taken from the 2020 U.S. Census.
Statistical Testing
All of this data was analyzed using logistic regression models to determine which variables most significantly predict student graduation rates from ELL programs. Logistic regression was chosen over linear regression or other models because of the nature of the dependent variable----graduation rate percentages----which are inherently between 0 and 1. Logistic regression is particularly suited for such cases where the outcome is a probability or a percentage.
The variables tested included school level (categorized as elementary, K-6, middle, 6-12, and high), teacher experience (categorized as inexperienced, limited-certificated, and out-of-field), the size of the ELL population at each school, and median income by zip code. Initially, the variables were entered into the model together to assess their impact on ELL program graduation rates. However, when predictor variables are highly correlated with each other, known as multicollinearity, it becomes difficult to determine each variable’s individual effect on the outcome. To avoid this issue, variables that showed statistical significance were then tested individually in the model. The outliers were thus deemed insignificant to graduation rates.
Statistical Significance Threshold
We evaluated the significance of each variable by examining the resulting p-value, which indicates the probability that the observed relationship between the variable and graduation rates is due to chance. A p-value ≤ 0.05 was considered statistically significant, hence a meaningful association between the variable and graduation rates. The lower the p-value, the stronger the evidence that the variable in question is a significant contributing factor to graduation rates from the ELL program.
Key terms
Limited-Certificated status: In WA, a limited-certificated teacher is allowed to teach one or more courses under a limited certificate temporarily when a fully certificated teacher is not available. These certificates are valid for one year and can be renewed up to two times, allowing for a maximum of three years of teaching. Limited certificates include conditional, emergency, and emergency substitute teacher certificates, each designed for educators who do not fully meet the standard certification requirements (Report Card - Washington State Report Card, 2024; Yoon et al., 2019).
Inexperienced status: In WA, an inexperienced status teacher means that a teacher has been teaching for less than five years (Report Card - Washington State Report Card, 2024).
Out-of-field status: In WA, out-of-field status means that a teacher is teaching one or more courses out of their certified area of knowledge: “A teacher certified to teach Chemistry and assigned to teach a Chemistry class is teaching this class in-field, whereas this same teacher assigned to teach Algebra II would be teaching this class out-of-field” (Report Card - Washington State Report Card, 2024; Van Overschelde & Piatt, 2020).
Results
Based on the logistic regression modeling results in the figures below, we can assess statistical significance using the p-values from the P>|z| column.
The p-value for Median Income by Zip Code, reported as 0.000, is highly statistically significant, as the value is so small that the three decimal places cannot display the number (Fig. 1). The p-value for the Number of English Language Learners is statistically significant, at 0.001 (Fig. 1). The p-value for Limited Certificated Teacher Status, while less significant, still meets the threshold at 0.036 (Fig. 1). Statistically, these three factors are the only factors that significantly affect graduation rates. Other variables, such as school level or other teacher certifications, do not show statistical significance as their p-values exceed 0.05 (Fig. 1, Fig. 2).

Discussion
This study aimed to investigate the factors influencing graduation rates from ELL programs in King County schools. Specifically, it examined how EL student population size, median income by zip code, school level, and teacher certification status impact ELL program graduation rates. The goal was to identify specific factors that impact the effectiveness of ELL programs to provide insights that can inform policy and educational practice.
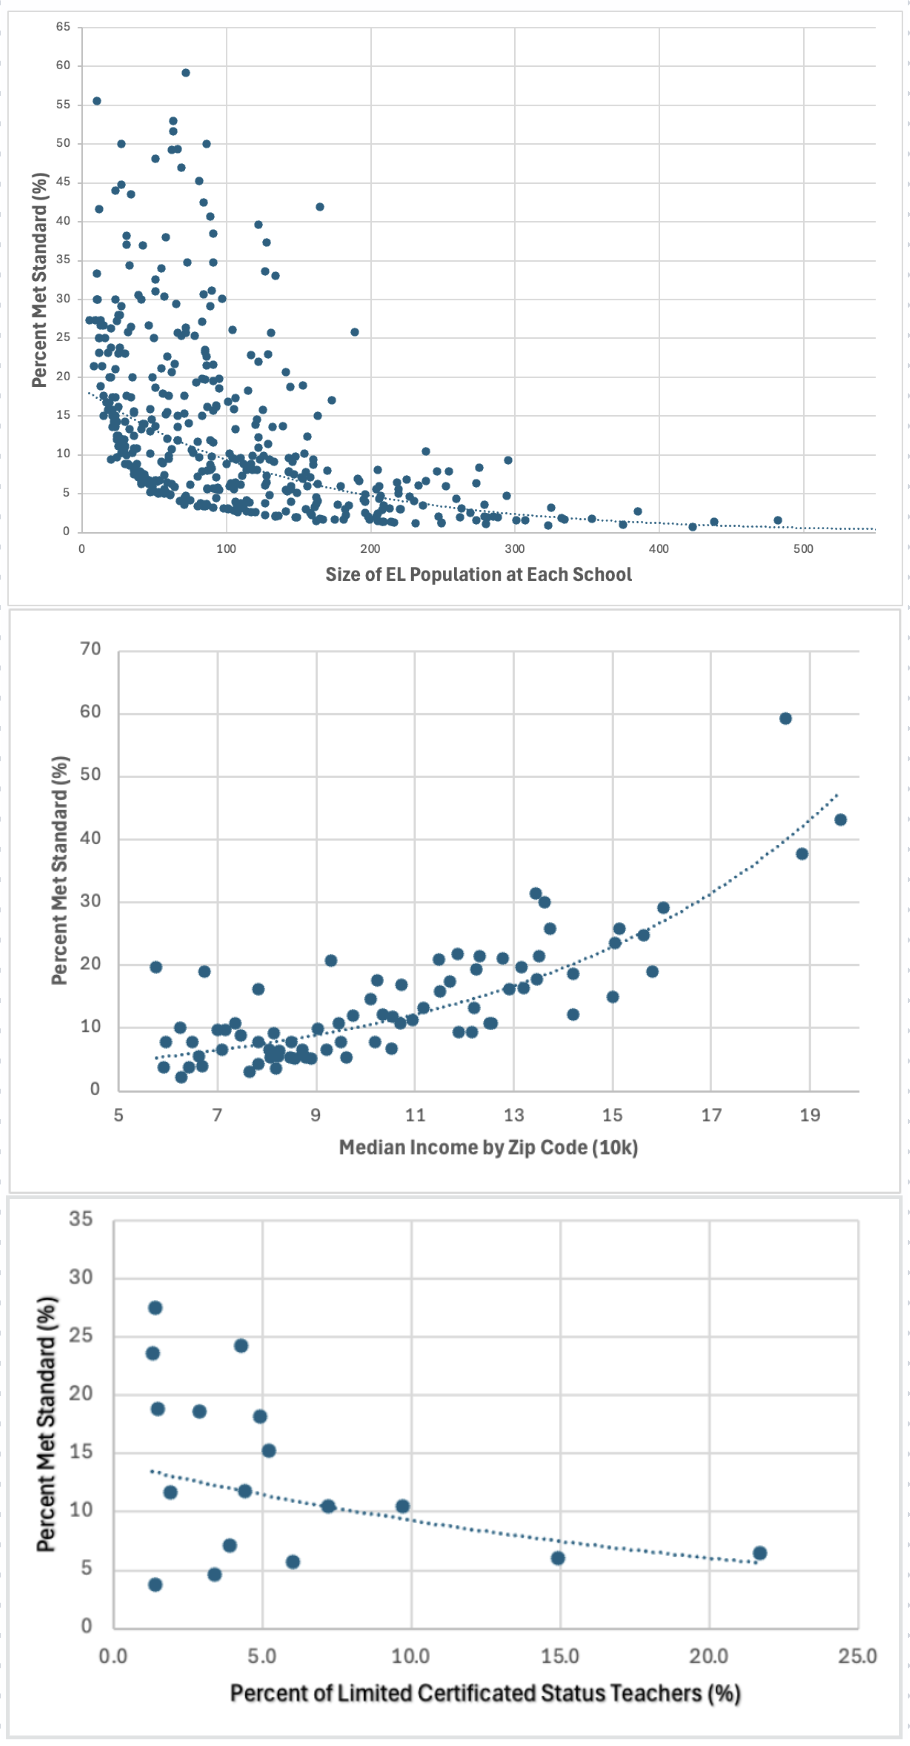
The analysis revealed several significant findings. First, there is a negative correlation between the number of ELs in a school and the program’s graduation rates. Schools with larger EL populations tend to have lower graduation rates, while those with smaller populations have higher rates. For example, the largest school in our sample, with 482 ELs, had a graduation rate of just 1.54%, whereas the smallest school, with 10 ELs, had a graduation rate of 55.56%, which is 36 times greater.
Second, the study found a significant positive correlation between median income by zip code and graduation rates from ELL programs. Schools located in higher-income areas tend to have higher graduation rates. Specifically, the highest-income zip code, with an annual median income of approximately $200,000, had a graduation rate of 43.08%. In contrast, the lowest-income zip code, around $60,000 annually, had a graduation rate of 3.73%, which is 11 times lower.
Third, schools with higher percentages of limited-certificated ELL teachers showed lower graduation rates. The school district with the highest percentage of limited-certificated ELL teachers (21.7%) had an average graduation rate of 6.52%, while the school district with the lowest percentage (1.3%) had a graduation rate of 23.63%, nearly 4 times higher.
While other factors, such as whether a school is elementary level or high school level, inexperienced teaching status, and out-of-field teaching status were also analyzed, they did not show statistically significant effects on graduation rates. This suggests the cognitive language-acquiring ability of students of different ages does not affect an ELL program’s effectiveness. It also suggests that younger teachers and even instructors teaching out-of-subject are not strong contributors to the variance in graduation rates.
The correlation between low ELL graduation rates and large EL student populations, low-income areas, and high percentages of limited-certification teachers likely stems from broader systemic issues. In Washington State, schools are primarily funded by taxes. Schools in higher-income zip codes have more resources since they are drawing taxes from a wealthier population. This translates to better facilities and more educational materials, which are often more attractive to qualified teachers specializing in EL instruction. On the other hand, schools in lower-income areas struggle more with limited funding, which leads to fewer materials and difficulties in giving every EL the individualized support they need – all of which can restrict student progress. Another reason for this correlation is that high EL populations often correlate with immigrant-heavy districts, which, on the whole, tend to be lower income. In other words, low-income areas tend to have large EL student populations, and the two factors – both of which negatively impact ELL graduation rates – compound upon each other.
The inverse relationship between limited-certificated teachers and graduation rates points to the ongoing teacher shortage in Washington State, particularly in specialized areas like bilingual education. According to the Learning Policy Institute, more than 6,000 teachers were estimated to be not fully certified in their teaching assignments during the 2022-2023 school year in Washington, which is roughly 10% of the state’s total number of teachers (Tan et al., 2024). This shortage forces schools, especially those in high-need areas like bilingual education, to rely on underqualified staff (Brief: Eliminating Educator Shortages through Increasing Educator Diversity and Addressing High-Need Shortage Areas, 2023). These teachers may not have the training or capacity to address the diverse needs of individual ELs effectively, which adversely affects students’ learning outcomes. A nationwide survey conducted in 2022 shows that “only 30% of the teachers surveyed feel fully prepared for teaching multilingual learners” (ELSF, 2019). This creates a challenging learning environment where students do not receive the individualized instruction they need, which can lead to lower graduation rates from the ELL programs.
There are, it should be noted, several limitations to this study. This study focuses solely on data from the 2022-2023 academic year, which, consequently, does not address broader trends. Expanding the scope to multiple years in future research would allow for a more comprehensive analysis of trends and better identification of long-term patterns. This would also help in understanding how changes in policy, funding, and teacher recruitment affect ELL program outcomes. The use of district-level data as a proxy for school-level information about teacher certification may also obscure important differences between individual schools, limiting the granularity and accuracy of the findings. Finally, while this study focuses on King County, the challenges identified are not unique to the county or the state of Washington. Similar issues are present across the United States, particularly in areas experiencing significant migrant influxes in recent years. There is an urgent need for targeted interventions nationwide to address teacher shortages and ensure that all ELL students receive the high-quality education they deserve. Future research could explore the optimum strategy to implement suggestions for the identified factors in this paper. Longitudinal studies could also examine the long-term effects of these factors on ELL students’ academic and career achievements.
Reviewing the results in this paper, however, makes it evident that systemic changes are necessary to address the disparities highlighted by the correlations in this study. One crucial area is the equitable distribution of funding across schools in different socioeconomic classes. Policies that allocate additional resources to schools in lower-income areas could help mitigate the effects of funding discrepancies. Such resources could be used to reduce class sizes and enhance support services specifically tailored for ELL students.
Addressing teacher shortages is another critical step. Redistributing resources to send more fully certificated ELL teachers to high EL population schools is essential. Implementing incentive programs alongside salary raises —such as loan forgiveness or housing assistance—will help attract and retain qualified ELL teachers in high-need schools. This approach would ensure that schools with high ELL populations have access to fully certified teachers, which would directly address key factors impacting graduation rates. By doing so, we can not only transform individual futures but also enrich the entire King County community.
Acknowledgments
I would like to thank Huaiye Zhang for his invaluable guidance as an expert advisor through data gathering, analysis, and the writing process. I would also like to thank my family for their relentless support and encouragement throughout this entire process.
Conflicts of Interest
I have no conflicts of interest.