Summary
Voters in the United States have been increasingly adopting negative views of people in different political parties then themselves, so I was interested in investigating the correlation between this polarization and individuals’ consumption of misinformation. Specifically, I investigated this correlation at the high school level, as there is a gap of research about these concepts among young adults. I used survey research to gather data (so I was unable to track every source that subjects used for information), but I found that none of the subjects in my study reported using fake news as a primary source of information. Most significantly, I discovered that individuals who had the highest polarization scores were most likely to rely on social media, family, and biased news sources for information.
Introduction
Polarization, animosity, division. These terms are used in news reports, research articles, and everyday discussions to describe the American political climate. However, few Americans understand how the United States of America evolved to be viewed as a distinctly divided nation. Political polarization is defined as a divergence towards extreme political beliefs, but reality of this concept’s applicability to the average American has been debated, as recent research reveals the role the media and inconsistent surveying have played in exacerbating America’s divided reputation (Iyengar et al., 2019a; Pew Research Center, 2014)). Nevertheless, a growing body of literature on America’s political division clearly showcases growing negative partisan views of opposing political parties. Over the past approximately 30 years, American’s negative views of differing political parties has grown from 6% to 26% (Nadeem, 2022; Orr & Huber, 2020). As research has transitioned to analyze the intersections of political hostility and identity, the term affective polarization has been coined to refer to partisans’ tendency to view their own party members positively and those with differing political opinions negatively, even on non-political measures (Orr & Huber, 2020).
The importance of studying affective polarization is amplified when put into conversation with literature on the psychology of misinformation belief. As online availability of information has increased, so too has the amount of false information consumed by the public. Partisans are more likely to believe information aligning with their political beliefs, regardless of factuality, compared to information divergent from their political beliefs (Derreumaux et al., 2023; Mosleh & Rand, 2022). Partisan tendency to believe misinformation is intensified by media sources utilizing emotional components in reporting, an increasingly common strategy in political news (Kahne & Bowyer, 2017). While correlations between affective polarization and misinformation have been established among adults, these variables have only been examined separately in relation to high school students. To better understand the influence of politics among high school students, this research is geared to answer the following question: “Is there a correlation between affective polarization and misinformation for students at High School X?”
Investigating Affective Polarization
Accumulating research on affective polarization identifies increased media availability and identity politics—the way in which individuals view themselves in relation to their political beliefs— as the driving forces of polarization in partisan life. The article The Origins and Consequences of Affective Polarization in the United States (2019b) concludes that American identity politics is shaped by the American political system, where the Democratic and Republican parties thrive on divisive campaign strategies to gain traction for their own agendas. Moreover, the article explains how party identities often remain the same throughout an individual’s lifespan, solidifying the separation and dissension between political parties (Iyengar et al., 2019b).
Orr and Huber (2020) concluded that partisan animosity is strongest when individuals do not know personal information about others—only their political affiliation—and animosity subsequently decreases as partisans feel more personally connected to those with opposing political perspectives. Because social media initiates interaction between strangers, political discussion on social media emphasizes political identity, therefore increasing hostility between opposing groups. Further solidifying the role of social media in amplifying polarization, Bor and Peterson (2022) found that political discussions online are often perceived as more hostile due to the amplification of comments from users who exercise “support for and engagement in aggression.”
Research on affective polarization largely presents this phenomenon and subsequent political anger as issues that need to be solved (Huddy & Yair, 2021; Webster, 2020). Affective polarization is grounded in the understanding that “any such in-group/out-group distinction triggers both positive feelings for the in group and negative evaluations of the out group” (Iyengar et al., 2019b), and Renström, et al. (2023) found that “when individuals perceive a threat to the ingroup, they become affectively polarized conditional on experiencing anger.” These characteristics of affective polarization indicate that demographic factors such as race could influence affective polarization, as policies on race and treatment of minorities are wielded by political candidates to gain support from different demographics. It is unsurprising, therefore, that Westword and Peterson (2020) concluded that “partisan affective polarization is also a consequence of the non-political racial interactions of Americans,” and at the international level, “there is an indication that affective polarization will, on average, be higher in countries where ethnicity is considered politically relevant” (Bradley & Chauchard, 2022).
Social justice perspectives on anger acknowledge the critical role this emotion plays in creating systemic change. In the book The Case for Rage: Why Anger is Essential to the Anti-racist Struggle, Cherry writes that “anger plays the role of expressing the value of people of color and racial justice; it provides the eagerness, optimism, and self-belief needed to fight against persistent and powerful racist people and systems,” citing examples of the way anger empowered freedom fighters like Martin Luther King Jr. and Ida B. Wells. Understanding how political anger manifests as a form of resistance against oppression, discussions within this article aim to present this anger and subsequent polarization, not as issues to be solved, but as phenomena to be explored. Using demographic information, this research will examine correlations among races and affective polarization with the hope of garnering a better understanding of these phenomena among high school students.
The Psychology of Misinformation
Affective polarization intensifies partisans’ misinformation trust and biases information consumption behaviors towards sources complimentary of one’s political beliefs. Academic research about misinformation was impacted by the 2016 presidential election, where Grinberg and colleagues (2019) used algorithmic tracking on 16,500 Twitter (now X) accounts to analyze the types and factuality of media that participants were viewing during the election cycle. Grinberg discovered that most false news (80%) is consumed by only 1% of X users, who primarily shared the same two factors: high political engagement and a long Republican voting history.
Furthermore, a literature review on the components of misinformation belief by Ecker and colleagues (2022) identified that cues from the attractive, the elite/famous, and those with aligning ideological views critically impact the extent to which misinformation is trusted. Just as social media elites and in-groups impacted individuals’ levels of affective polarization, these same factors are prevalent in determining the extent to which information is viewed as trustworthy by a given individual. Affirming these findings, Jenke (2023) concluded that individuals with a strong bias toward their own party were also more likely to believe misinformation that supported their political bias.
Research at the High School Level
A succinct review of research on affective polarization and misinformation demonstrates that most data collection procedures use survey and browser tracking strategies to analyze the behavior of individuals 18 or older. While both variables have been analyzed individually among younger demographics, there is little understanding of the relationship between these two variables among high school students, creating a gap in the understanding of misinformation and affective polarization.
A research team led by Hartman (2022) evaluated common strategies to address affective polarization and anger among high school students, focusing on the TRI (Thoughts, Relationships, and Institutions) method. This method encourages individuals to identify biases in their political anger before engaging in discussion about their emotions and advocating for political change based on their anger (Hartman et al., 2022; Iyengar et al., 2019b). However, it is important to note that perspectives on handling affective polarization in the classroom have not been concretely tested, with research primarily focusing on theory thus far.
There are similar gaps in research on misinformation in the classroom, despite many scholars insisting that this issue should be a priority for research. Survey research headed by Owen (2022) concluded that while technology has become increasingly utilized for fact checking and teaching students about misinformation, civics teachers still feel unprepared to teach students the tools to properly combat misinformation in their own lives. Additionally, misinformation is widely recognized as a danger in education, and many sources provide their own recommendations to address this issue. However, these recommendations are primarily based on understandings of the psychology behind misinformation, as opposed to actively testing the effectiveness of combative strategies (Council of Europe, n.d.).
The topics of affective polarization and misinformation have been recognized as important variables in the United States’ current political climate and as connected among adult populations. This research will investigate if the same is true among high school aged individuals, with a goal of increasing academic understanding of how these factors impact future voters. Prior to conducting any research, I predict there will be a positive correlation between misinformation consumption and affective polarization among high school students, but that the correlation will be less significant than that found in adults. I also predict polarization at the high school level will be influenced by friends and family more than by information consumption behaviors.
Methodology
This research examines the correlation between levels of affective polarization and misinformation at a mid-sized central Pennsylvania high school (School X) using survey research via Microsoft Forms software, which allowed me to gather quantitative and qualitative data anonymously.
Testing Affective Polarization
To evaluate students’ levels of affective polarization, I used Likert scale questions about individual’s agreement with how various personality traits suited Democratic and Republican voters and candidates. Participants responded on a five-point Likert scale, following a methodology used Druckman and Levendusky (2019). All questions focused on the Democratic and Republican parties, as current research on affective polarization focuses on the two-party system as the primary source of polarization (Iyengar & Llekes, 2019). These researchers also examined feeling thermometers, or “a rating that asks respondents to rate how cold (0) or warm (100) they feel toward the Democratic Party and the Republican Party.” Druckman and Levendusky’s research identified that “on every measure [Likert scale-questions and feeling thermometers], respondents are considerably more negative toward the elites of the other party than they are toward voters or the parties,” so I applied these same two question types to my research to observe if these conclusions remain true at the high school level.
Feeling thermometers, the most common way to measure affective polarization, allowed me to gauge responders’ views of voters and politicians separately, while Likert scale questions gauge responders’ feelings towards entire political parties. However, I did have to make one change to traditional feeling thermometers; my software only allowed “thermometers” on a scale from one to ten, so the data received is multiplied by a factor of ten when put in context with other affective polarization research (Lelkes & Westwood, 2017; Orr & Huber, 2020).
Testing Misinformation
To analyze subjects’ misinformation levels, I chose one open-ended question about sources of information and one ordering question, where participants were asked to rank types of news sources based on how frequently they use them. The ordering question provided a quantitative measure to compare responses, while the open-ended question provided more nuance about specific news sources. When deciding what source types to include in my ordering question, I consulted Pew Research’s 2023 survey of common teen news sources, alongside Pew’s and the American Association of Pediatrics’ analysis of trends in teen news consumption behaviors (Anderson et al., 2023; Jurkowitz et al., 2020; Liedke & Wang, 2023; “Media Use in School-Aged Children and Adolescents,” 2016).
Most research on misinformation involves browser tracking—a technological resource not available to me (Grinberg et al., 2019; Mosleh & Rand, 2022). While this lack of technology was a limitation in my research, I instead evaluated subjects’ misinformation by comparing responses to a database of fake news sites created by Grinberg and colleges from their 2019 study evaluating misinformation on X. I also referenced AllSides’ media bias database, a source utilized in Grinberg’s research for understanding news credibility, to draw conclusions about the bias of respondents’ sources.
Demographic and Party Questions
I included common demographic questions to identify patterns among participants based on race, asking participants to select all that applied from the following options: Asian American/Pacific Islander, Black/African American, White, Hispanic/Latinx, and Indigenous/Native American. At the end of my survey, I asked students what political party they identified most with (Democratic, Republican, or Other, with the option to type in another party) to contextualize subjects’ responses to questions analyzing affective polarization. I grouped “other” responses into an unaffiliated or third-party category and analyzed their responses in relation to the two main parties. I chose to put this question at the end of my survey, as I did not want to influence subjects to think in terms of their party when answering the initial questions.
Survey Administration
The subjects for my survey included 145 students at School X ranging from ninth grade to twelfth grade. I chose to work with the English department at School X for administering my survey, as every student at School X is required to take English every year of high school. Furthermore, the English classes in my survey included all three levels of English difficulty at School X, therefore achieving the broadest range of participants possible. One English teacher from each grade presented the survey to their class, giving them 10-15 minutes to complete it during a typical class period.
Results and Analysis
A total of 145 survey responses were received, with the largest group coming from tenth grade students. Responses were grouped based on students’ party affiliation into four categories; the most responses (38%) came from the Unaffiliated category, composed of students who responded that they were Independent, did not connect to a certain political party, or were unsure of their affiliation. Only five Third Party responses were received, so any analysis for this group will not be treated as coming from a representative sample.
Average Affective Polarization by Party
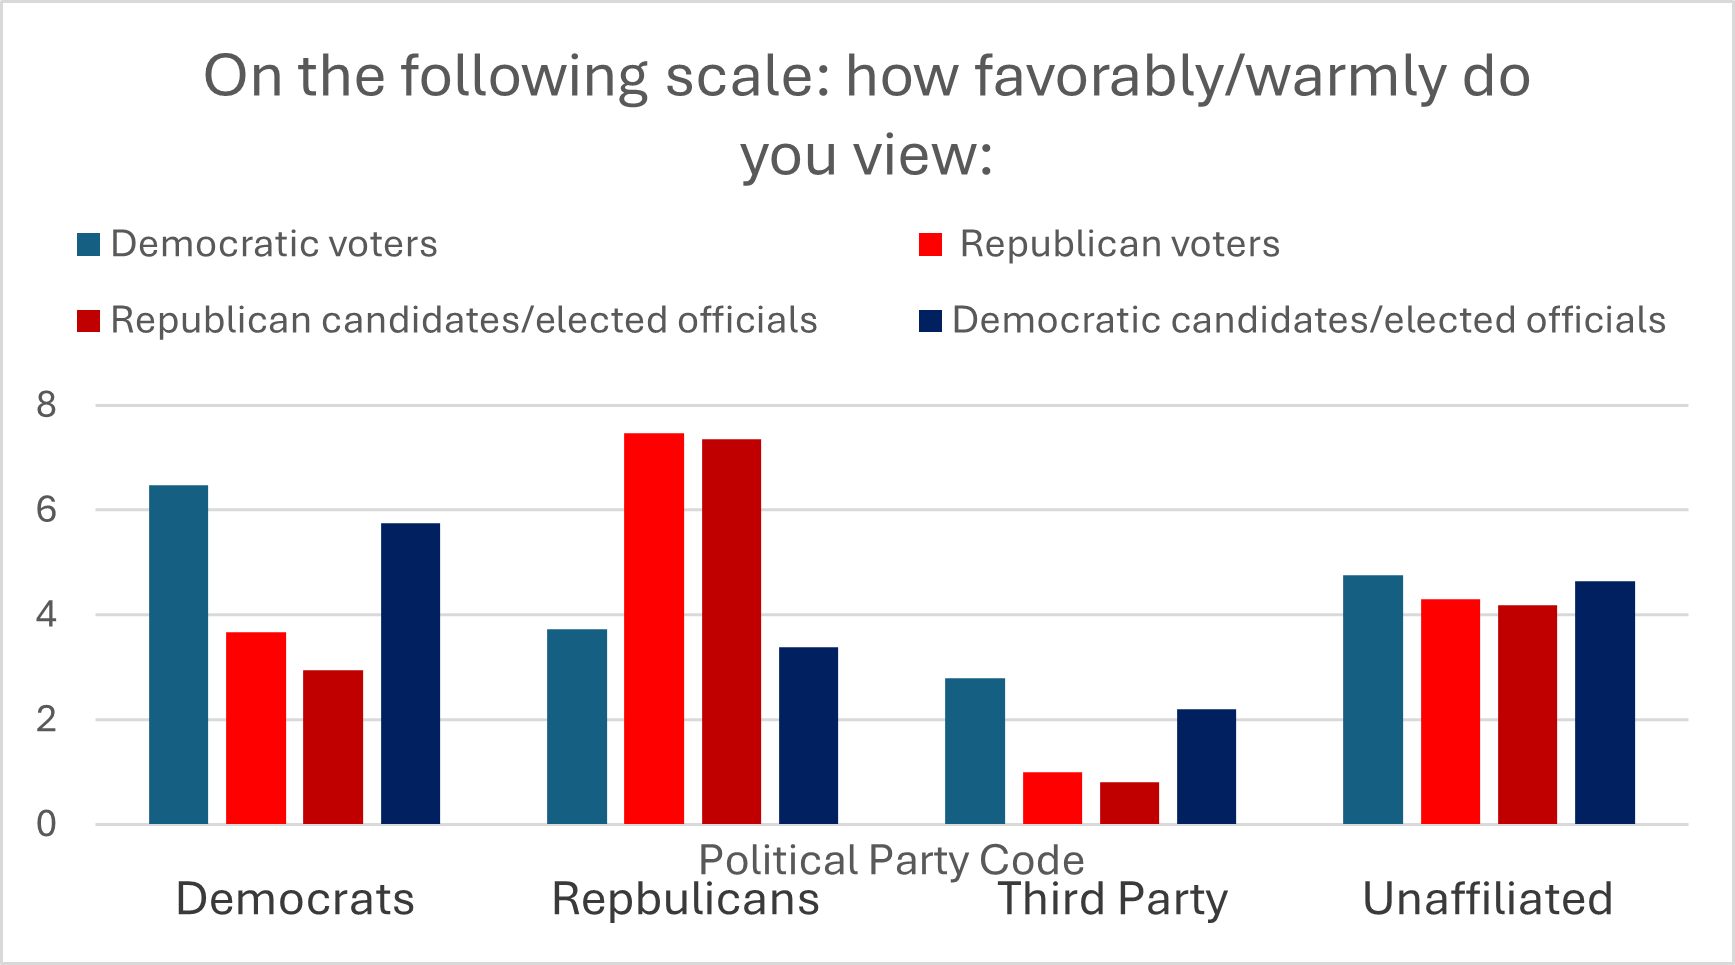
Figure 1 shows average feeling thermometer responses about Democratic and Republican voters and elected officials/candidates [on a 0-10 scale, 0 indicating an unfavorable view and 10 a favorable view of the group in question], when responses were grouped by party affiliation. As expected, Democrats and Republicans viewed their own party more favorably across both measures. Additionally, Democrats and Republicans both demonstrated a slight preference for voters over candidates/elected officials among both parties—Democrats to a greater extent than Republicans—which is in accordance with past research on partisan preference for voters over political elites (Druckman & Levendusky, 2019). Republicans’ responses about fellow Republican voters and elected officials were the strongest mean favorability responses, while the Unaffiliated group had the most moderate responses.

All Likert scale responses measuring affective polarization were coded numerically [1: Strongly Disagree, 2: Somewhat Disagree, 3: Neutral, 4: Somewhat Agree, 5: Strongly Agree] to understand average party polarization. While there was rarely a large difference between Democrat/Republican responses to questions about their own party versus the opposing party, Republicans were the only main group to average more than one unit away from “Neutral,” averaging just over four when rating intelligence and morality for their own party and meanness for the opposing party. Unaffiliated persons tended to fall in the middle of the Democrats and Republicans.
Comparing Information Consumption
To determine a possible correlation between affective polarization and misinformation, I calculated each respondents’ polarization score and grouped those with the high scores together, so I could compare this group’s most common sources of information to the overall most common information sources, calculated from all respondents. The most polarized responders (MP) were determined based on a normalization of the Likert scale and feeling thermometer questions about respondents’ opposing party, subtracted from the same data for their own party, so that perfectly neutral responses would yield a score of zero and completely polarized would yield a score of 30. Only responses from individuals who identified as Democrat and Republican were utilized because affective polarization is defined as the partisan preference for one’s own party over the opposing party. Unaffiliated responders are considered nonpartisan, and it was not feasible to ask questions about all third parties, so the research only allowed for calculating polarization scores for Democrats and Republicans. The 17 individuals singled out as MP all have a polarization score of 15 or above. This grouping provided me with a sample size large enough to adequately compare the information consumption behaviors of the most polarized responders to the average group.
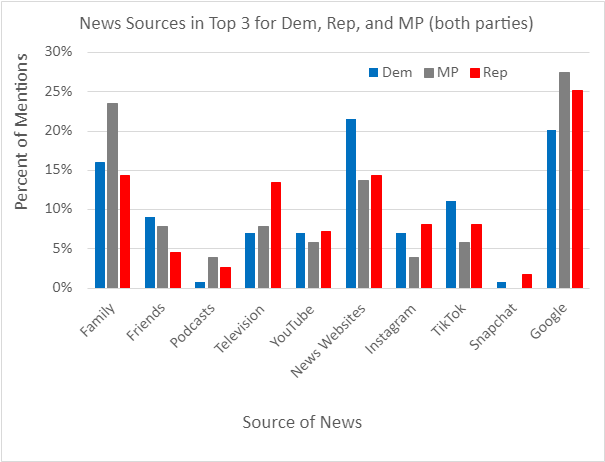
Based on subjects’ ranking of nine pre-chosen news categories, Figure 2 showcases the percentage that each of the categories occurred in Democrats, Republicans, and the MP’s top three selections. Google was the primary source for three of the average party groups (Democrats slightly favored news websites). If this experiment were to be repeated, the researcher would recommend not including Google as one of the pre-chosen news categories; while it was initially included with the hope it would showcase groups who actively research specific information as opposed to consuming it passively, search engines funnel other sources of information to their viewers, so this category will likely not be applicable to my understanding of source credibility.
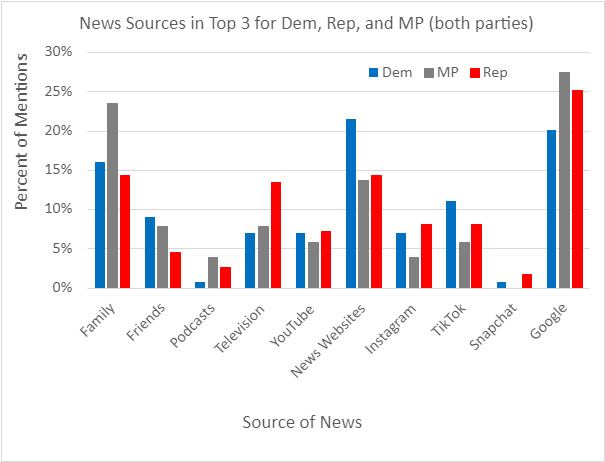
Overall, the most significant difference between the two groups was the MP responders’ stronger reliance on family for information regardless of party, highlighting a possible correlation between high schoolers’ polarization and their reliance on family for information. Compared to average news ranking responses, the most polarized group relies on family 7-10% more than average Democrats and Republicans, News Websites 7% less than average Democrats (average Republicans were about the same as MP), television 6% less than average Republicans (average Democrats were 1% less than MP) and Google 8% more than average Democrats (3% more than average Republicans). All other MP responses were within 5% of the average Democrat and Republican responses.
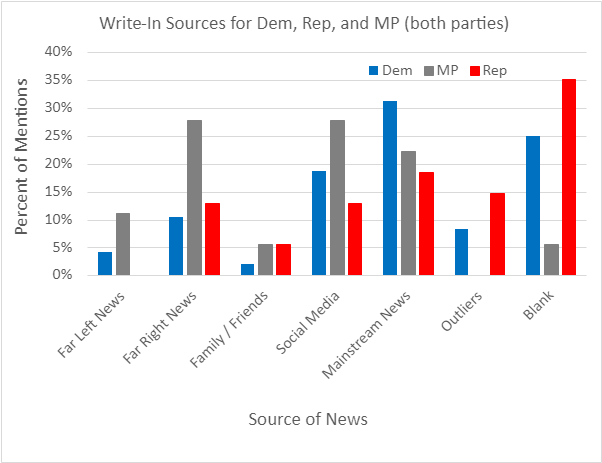
Figure 3 shows a coding of Democrat, Republican and MP’s responses to the open-ended question asking subjects to list their top three specific news sources. All responses were first cross-referenced with Grinberg’s database of fake-news sources and none of the responses to the survey were recognized as fake news in his research (Grinberg et al., 2019). Utilizing AllSides Media’s partisan analysis of sources, responses with any sources recognized as Far Left or Far Right were then coded appropriately. With the remaining network responses, those with a majority of sources recognized as Left Lean, Center, or Right Lean, were coded in the Mainstream News category. The rest of the categories were based on the majority source type in subjects’ responses, with the Outlier category reflecting responses with no majority source type. All responders in the Blank category did not answer this question (it was the most unanswered on the survey), a limitation of the research. The Outlier and Blank categories were removed from further evaluation as they did not allow analysis of misinformation or bias.

Compared to average Democrats and Republicans, the MP relied more heavily on Far-Left News/TV (7-11%), Far Right News/TV (15-18%), and Social Media (9-15%). MP relied on Mainstream Networks 9% less than average Democrats (3% less than average Republicans). These results demonstrate a correlation between Far Left/Far Right News consumption and affective polarization, which is strongest for Far-Right News consumers. While not necessarily misinformation, Far Left and Far Right News are more strongly biased than the Mainstream News category, establishing a correlation between bias in news and affective polarization (Media Bias, 2023).
Additionally, MP responders significantly increased reliance on social media and decreased reliance on mainstream news networks for information together indicate a correlation between biased media consumption and affective polarization at the high school level—specifically politically-biased information and misinformation, which has been identified as increasingly more prolific on social media (Shin et al., 2018) (Wu et al., 2019).
Demographic Variables
As accumulating research suggests that race influences affective polarization, I considered how demographic variables impacted high school students’ affective polarization. The vast majority of the response pool was White, and of the individuals for whom affective polarization scores could be calculated, only the following groups had greater than five subjects: White (67), Black (6), and Mixed-Race (9). Despite narrowing analysis down to these groups, there is a significant limitation of sample size for both the Black and Mixed-Race groups. From this sample, White and Black respondents averaged about the same polarization scores,–4.7 and –4 respectively; however, those who identified as more than one race had a lower polarization score –8.3. These results indicate that identifying as part of multiple racial groups may decrease affective polarization, but more research on the correlation between race and affective polarization is necessary to confirm these findings.
Discussion and Conclusion
Addressing the Research Question and Aims
To answer the research question “Is there a correlation between affective polarization and misinformation among high school students?” this research employed standardized Likert scale and feeling thermometer questions to measure misinformation. However, identifying misinformation posed a greater challenge, as the researcher did not have access to browser tracking technologies for this study and opinions on information credibility changes based on political bias. The survey format the researcher chose based on these limitations asked subjects to rank various types of news sources based on the frequency with which they used them, and to answer an open-ended question about their top three specific sources of news. No responses to these prompts were sources established as fake news in Grinberg’s 2019 misinformation research, so conclusions were only able to be drawn about correlations between affective polarization and types of news sources. If this research were to be repeated, the researcher recommends using browser tracking to analyze the credibility of all information participants view; the results of this survey only signify that high school students’ main sources of information are not known fake news sites.
The original hypothesis from this study assumed a significant correlation between misinformation and affective polarization and a strong reliance on family and friends for information among the subject group; a correlation focusing on measured misinformation was unable to be proven or disproven, however the results display a correlation between affective polarization and biased news consumption. The MP respondents relied on social media, far right and far left news, and family more than average Democrats and Republicans. Far left/right media and social media are more biased than mainstream media sources, which the MP relied on less than the average respondent (Chen et al., 2021; Media Bias, 2023). While one may assume biased news sources contain more misinformation than mainstream news, the survey’s format was unable to track what information subjects gathered from each source, so it cannot directly correlate misinformation and affective polarization.
Contextualizing With the Literature
These results echo two foundational studies for this research (Grinberg (2019) and Mosleh and Rand (2022) studying adults on X), which both found that that extreme far-right partisans were the most likely to consume misinformation; this research extends these findings into discussions of affective polarization, as the results suggest the strongest connection between far-right news sources and affective polarization at the high school level.
Research from Jenk (2023) found a correlation between affective polarization and consuming information that validates one’s own biases, and this research demonstrates a correlation between affective polarization and consuming any heavily biased news sources. Further research about the impacts of biased news both opposite to and aligning with one’s own bias could add to present understandings about the correlation between polarization and biased information.
This research contributes to the body of literature with new findings about high school students’ political opinions, influences, and correlations between types of news sources and affective polarization. High school students are rarely studied in the political science field, so this research is one of the only to study how affective polarization affects younger individuals. In addition, the correlation between type of news and affective polarization presented in this study provides insights into potential causes of polarization among high school students, such as reliance on family and biased news, which can be built upon in future research on addressing affective polarization.
Acknowledgements
I would like to thank Dr. Sarah Niebler for her invaluable guidance as expert advisor on this research. I extend my gratitude to Mr. Kevin Wagner for his support and insights throughout the research and writing processes. For their moral support and editing advice, I am thankful for Lauren Kiehl and Natalie Buss. Finally, thank you to my family for their encouragement and guidance, especially to my father for his help with data synthesis and presentation.