INTRODUCTION
Glyphosate, a popular herbicide widely applied to weeds and grasses to prevent their growth, has had its safety questioned (Henderson et al., 2010). First developed in the 1950s, glyphosate was not registered for use in the United States until 1974, when it was introduced in the product Roundup (Benbrook, 2016). Since then, more than 750 commercial and household-use products have been manufactured containing glyphosate (Henderson et al., 2010). By 2015, glyphosate had become “the world’s most widely used herbicide” (Clapp, 2021).
Glyphosate’s toxicity is a highly debated topic. The International Agency for Research on Cancer (IARC) found in 2015 that glyphosate is likely carcinogenic to humans. Likewise, the IARC concluded that both pure and formulated glyphosate were likely genotoxic (IARC, 2015). In addition to possibly being carcinogenic, glyphosate may affect the immune system’s lymphocyte functions and its interactions with microorganisms due to glyphosate’s cytotoxic and genotoxic characteristics (Peillex & Pelletier, 2020). Furthermore, studies suggest that long-term exposure to glyphosate could result in chronic diseases including cancers, diabetes, neuropathies, obesity, asthma, infections, osteoporosis, infertility, and birth defects (Mesnage & Antoniou, 2017; ToxFAQs for Glyphosate, 2020). However, these conclusions contradict the EPA’s, which did not find evidence that glyphosate causes cancer or other health effects in humans (EPA, 2023).
Benbrook identifies explanations for the EPA’s glyphosate toxicity conclusions. Firstly, the EPA relied on registrant-commissioned, unpublished studies while the IARC relied on peer-reviewed studies, many of which showed positive genotoxicity (Benbrook, 2019). Secondly, the EPA focused on technical glyphosate studies, while the IARC emphasized formulated GBH and AMPA assays (Benbrook, 2019). Lastly, the EPA considered solely dietary exposures, whereas the IARC included occupational and elevated exposures (Benbrook, 2019). Benbrook concluded that the EPA’s assessment did not adequately address higher occupational exposures, emphasizing that more research on “real-world exposures to the chemicals” would be necessary to determine their consequences (Benbrook, 2019).
Moreover, in 2013, researchers determined that most glyphosate usage in California was found “in the eight counties that had the highest percentage of people living below the federal poverty line,” suggesting a socioeconomic correlation (Donley et al., 2015). Furthermore, the study found a correlation between disease and high exposure to pesticides, highlighting the disproportionate burden that BIPOC and low-income communities experience due to their heightened exposure (Donley et al., 2022).
Our study explores the potential of machine learning to predict glyphosate contamination across the United States by analyzing US Geological Survey data and the EPA’s EJScreen API. We developed two machine learning models to uncover relationships between socioeconomic and environmental indicators and glyphosate levels respectively, including predictions for non-reporting counties. Our findings demonstrate the power of machine learning in pesticide detection and environmental management, offering a scalable framework for other contaminants. These models can capture trends and interactions that traditional statistical methods may miss, enhancing environmental decision-making and guiding targeted testing.
METHODS
Tools
This investigation used Jupyter Notebook and Google Colab for Python Programming. The following packages and libraries were used for data analysis: Pandas, GeoPandas, Matplotlib, PyCaret, and Optuna (Geopandas, 2024; Matplotlib, 2024; Optuna, 2024; Pandas, 2024; Pycaret, 2024).
Data Cleaning and Scraping
Pesticide data on counties and county equivalents was first gathered from the Estimated Annual Agricultural Pesticide Usage dataset by the United States Geological Survey and filtered to solely include glyphosate (Wieben, 2019).
Next, we gathered socioeconomic and environmental indicators by county using the EJScreen API, an environmental justice data collection tool provided by the EPA (US EPA, 2021). National Demographic and Environmental Percentiles were utilized to standardize data on a national scale, allowing for comparison across states (US EPA, 2014).
The following national percentiles of socioeconomic indicators were scraped from EJScreen for counties across the United States:
-
Under Age 5
-
Unemployment Rate
-
People of Color
-
Limited Life Expectancy
-
Low Income
-
Less Than High School Education
-
Limited English Speaking
-
Over Age 64
The following national percentiles of environmental indicators were scraped from EJScreen for counties across the United States:
-
Lead Paint
-
Diesel Particulate Matter
-
Toxics Cancer Risk
-
Toxics Respiratory HI
-
Traffic Proximity
-
Wastewater Discharge
-
Superfund Proximity
-
RMP Facility Proximity
-
Hazardous Waste Proximity
-
Ozone
-
Particulate Matter
-
Underground Storage Tanks
-
Toxic Releases to Air
Mapping Pesticide Concentration
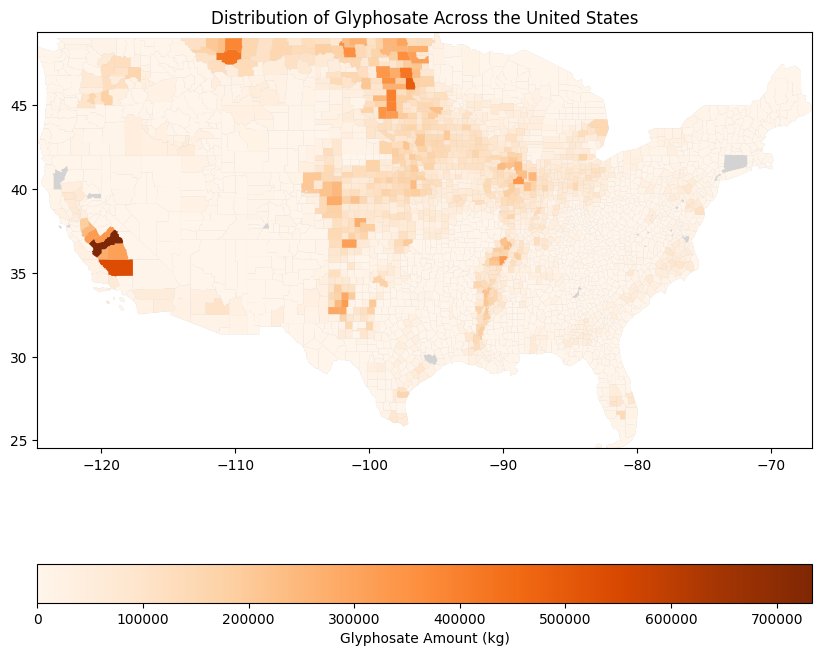
The GeoPandas library was used alongside TIGER/Line Shapefiles to map the distribution of Glyphosate across the United States, providing a clear visual overview (Figure 1) (TIGER/Line Shapefiles, 2023).
Feature Importance & Correlation Coefficients
In our analysis, we used Scikit-learn’s feature importance method. However, feature importance scores highlight the magnitude of each feature’s impact on the model’s predictions, not the direction. To address this, we employed Pearson correlation coefficients, which measure both the direction and strength of linear relationships between two continuous variables.
A coefficient of 1 signifies a perfect positive relationship whereas a coefficient of -1 signifies a perfect negative relationship (McClenaghan, 2024). The Pearson coefficient was chosen for its common usage and effectiveness in identifying linear correlations between quantitative variables, making it well-suited for our analysis of pesticide usage and its relation to socioeconomic and environmental features.
Tables 1 and 2 display the Pearson correlations of environmental and socioeconomic features with glyphosate quantiles, respectively. Additionally, these figures rank the features in descending order of their feature importance scores. By presenting the features in this manner, we can observe both their significance in the model and the direction of their impact.
Model Development
To ensure that the high variance in the data did not affect model predictions, Glyphosate concentrations were divided into two quantiles for binary classification. Higher concentrations in the upper quantile above the median were labeled 2 while lower quantile concentrations were labeled 1.
The dataset was then split into an 80% training set and a 20% testing set to ensure generalizable predictions on unseen data. Then, PyCaret’s compare_models() function was used to find optimal machine learning models. A Random Forest classification model was shown to have the most optimal preliminary performance for both the socioeconomic and environmental models (Pycaret, 2024). This selection was further validated through several manual trials, confirming the Random Forest model’s strong performance.
Random Forest models use decision trees to recursively classify data into subgroups to maximize information gain and produce predictions. Splitting data allows tree models to excel with non-linear or highly skewed data. The model ‘bootstraps’ by randomly selecting sample subsets of training data; this process increases pattern encapsulation and reduces data overfitting. In classification, predictions are based on majority voting between all decision trees (Louppe, 2014).
Hyperparameter Optimization
Optuna, a Python package that automates hyperparameter optimization in machine learning, predicts promising hyperparameter sets based on past iteration results. Optuna is much more efficient than the traditional grid search and random search methods (Optuna, 2024).
To ensure that optimal hyperparameters were found for each model, they underwent a 100-iteration tuning process through Optuna. The models were then trained on their respective features with optimal hyperparameters.
Evaluating Model Performance
Accuracy, precision, recall (sensitivity), and F1 score performance metrics, commonly used together to evaluate different facets of ML model performance, were calculated to evaluate performance on testing data (Bajaj, 2022).
Model Deployment in Non-Reporting Counties
Several US counties and equivalents did not report or test for glyphosate levels. Thus, in an attempt to guide future testing, both models were used to predict glyphosate levels in these non-reporting counties.
RESULTS

Model Performances
After running the Optuna package, the optimal hyperparameters for the environmental model were: n_estimators: 763; max_depth: 39; min_samples_split: 2; min_samples_leaf: 1.
Similarly, optimal hyperparameters for the socioeconomic model were: n_estimators: 783; max_depth: 35; min_samples_split: 8; min_samples_leaf: 2.
With these hyperparameters, the socioeconomic model had accuracy, precision, recall, and F1 scores of 72%, 69%, 79%, and 74%, respectively on the test set. The environmental model had accuracy, precision, recall, and F1 scores of 80%, 77%, 85%, and 80%, respectively. Overall, the environmental model performed better across all the above-listed metrics.
Model Deployment in non-reporting areas
41 county or county-equivalent areas in the United States did not test or report glyphosate levels. Out of these areas, Roanoke, VA (51770) and Covington, VA (51580) were predicted to have high glyphosate levels by both socioeconomic and environmental models.
Environmental Model Feature Analysis
The feature “National Percentile for RMP (Risk Management Program) Facility Proximity” was shown to contribute most significantly to glyphosate quantile predictions. This feature had a moderate positive Pearson correlation coefficient of 0.34, revealing that areas with presumed high glyphosate usage are correlated with facilities that handle highly toxic chemicals (Table 1). Next, the feature “National Percentile of Lead Paint,” was the second most significant model feature and had a moderate positive Pearson correlation coefficient of 0.37 (Table 1). The correlation between lead paint, which was banned in the US in 1978, and glyphosate usage indicates a trend that warrants further investigation (US EPA, 2013). Contrastingly, the features “National Percentile of Air Toxics Cancer Risk” and “National Percentile of Air Toxics Respiratory HI” presented negative Pearson correlation coefficients of -0.26 and -0.28, respectively, posing potential contradictions to previous research suggesting glyphosate’s carcinogenic properties (Table 1).
Socioeconomic Model Feature Analysis
In the socioeconomic model, “National Percentile of Under Age 5” had the highest feature importance score with a positive Pearson correlation coefficient of 0.26, suggesting a higher presence of glyphosate near younger populations (Table 2). Another significant feature was the “National Percentile of Unemployment Rate,” which had a negative Pearson correlation coefficient of -0.22 (Table 2). This indicates a moderate inverse relationship between the unemployment rate and glyphosate usage.
DISCUSSION
Model and Pearson Correlation Analysis
Pearson correlation coefficients between different features and glyphosate quantiles revealed a clear positive relationship between (1) RMP facilities and (2) Lead Paint usage and glyphosate levels (Table 1, Table 2).
RMP facilities are designated by the EPA because they handle and produce potentially dangerous chemical waste products. Based on the model, RMP facilities could be near areas of high glyphosate usage, meaning the surrounding environment could be overly exposed to chemicals. Furthermore, the EPA noted that underserved and overburdened populations are disproportionately located near RMP facilities compared to other groups. Approximately 131 million people reside within three miles of these facilities, including about 20 million who identify as Black or African American, 32 million who identify as Hispanic or Latino, and 44 million who have incomes at or below twice the poverty level (U.S. Environmental Protection Agency, 2024). This bolsters the fact that glyphosate contamination may be higher in areas of minority groups.
There were also positive correlations between the prevalence of lead paint and glyphosate usage. Lead paint is an indicator of the percentage of pre-1960s constructed houses, which are highly correlated with lower socioeconomic areas (Downes, 2022). This relationship between glyphosate and socioeconomic class housing levels suggests that glyphosate is used more heavily in lower-class, less-funded areas.
Despite the aforementioned features having moderate correlation coefficients with glyphosate, the majority of features had minimal relationships. However, the machine learning models were still able to effectively predict glyphosate usage, evidenced by their high accuracy, precision, recall, and F1. While the low feature correlations require more investigation, it also reveals that Random Forest models can capture complex, non-linear interactions. This may also suggest that glyphosate contamination is not driven by any single indicator, but rather by complex interactions among multiple features.
Model Analysis and Implementation
This study presents a model framework for glyphosate detection due to its potentially harmful effects and widespread use. Similar machine-learning approaches based on EJScreen data can investigate other pesticides and environmental contaminants. This will allow for a greater expansion of contaminant testing. As environmental testing awareness grows in scale, environmental agencies—local, state, and national—require more efficient testing and management practices to responsibly and equitably deploy resources and spending. Targeted machine learning models such as the ones developed in this study provide the ability to identify potentially highly contaminated areas, allowing proper allocation of resources and testing plans.
Moreover, the environmental and socioeconomic models presented in this research provide a technical framework for the prediction of various environmental contaminants, not just glyphosate. They can facilitate a more targeted environmental testing plan. While these models are useful for finding areas of predicted concern from environmental contaminants, they should be used alongside experts in the field to ensure proper usage to produce more informed research.
USGS data analysis (California)
According to the USGS data, Fresno and Kern County are areas that are heavily reliant on the agricultural industry, reflecting their extensive glyphosate usage (Figure 1; Fankhauser et al., 2023). Kern counties primarily produce almonds and grapes (Fankhauser et al., 2023). Herbicides like glyphosate are commonly used on pre-harvest vegetation when growing almonds and grapes (Martin & Hanson, 2022; Schwarez, 2018). Thus, Kern and Fresno counties’ agricultural output necessitates disproportionately larger amounts of glyphosates compared to other counties across the United States, supporting our findings.
While our correlations reveal an overall minimal relationship between glyphosate usage and communities of color, studies show that these communities “are already at serious risk from chemicals in their environment [being] the most likely to suffer from exposure to” glyphosates (Donley et al., 2015). The disproportionate environmental impact of glyphosate that communities of color—already socioeconomically disadvantaged—experience shows the need for societally conscious environmental policy. However, in 2023, U.S. courts blocked a California ruling that required businesses to warn customers about glyphosate’s carcinogenic properties (Reuters, 2023).
The U.S. must look to other countries, such as France, the Netherlands, Sri Lanka, and Colombia which have adopted full or at least partial bans on glyphosate (Donley et al., 2015).
Current studies completed by California’s EPA found that glyphosate-containing products do not seriously threaten California’s water supply; however, the study acknowledged that further review must be done to address the lack of sufficient toxicity data, restrictions on public release of data, and insufficient testing and monitoring (Corcoran et al., n.d). Furthermore, this study was conducted in 1984, suggesting that its data and conclusions are likely outdated. Other than this already indeterminate study, there have not been any studies conducted by the state of California on the effects of glyphosate usage.
USGS data analysis (North Dakota)
Richland County, ND has the third highest level of Glyphosate contamination. Several other North Dakota counties had the highest levels of contamination of glyphosate, which is unsurprising considering the state’s affinity for pesticide and herbicide usage in agricultural contexts (Figure 1). North Dakota’s second-highest industry is agriculture, specifically the wholesale of wheat, corn, and soybean (IBIS World, 2023). Glyphosate makes up 49% of all pesticides and herbicides used on farms, and between 63%-80% of soybeans, wheat, and corn samples had glyphosate applied to them (Sauter, 2022; United States Department of Agriculture, 2017). Under these circumstances, multiple lawsuits have been filed against Roundup due to farmers developing cancer, questioning the credibility of the EPA’s testing and policy protocols (Springer, 2019). This highlights the importance of researching, studying, and testing land for pesticides and herbicides as while the EPA has deemed glyphosate safe, there are concerns from people who are in contact with the pesticide regularly.
Prediction Analysis (Roanoke and Covington)
Roanoke and Covington are county equivalents in Virginia that have neither reported nor tested glyphosate contamination levels (Figure 1). Both counties were predicted to have upper-quartile levels of glyphosate by both the socioeconomic and environmental models.
Roanoke, in particular, falls into the 80th percentile of Risk Management Program Facilities proximity, suggesting the heavy presence of chemical contaminant-heavy industrial facilities. Similarly, Covington falls into the 92nd percentile of RMP facility proximity.
Glyphosate is primarily an agricultural herbicide, and RMP facilities typically manage industrial chemicals. The moderate positive Pearson correlation suggests a potential overlap between industrial areas and agricultural zones or the widespread presence of glyphosate in industrial settings. This overlap could indicate that glyphosate is used or produced in processes linked to these facilities, highlighting an intersection between industrial and agricultural chemical management.
Thus, Roanoke and Covington may be areas where environmental and public health risks might be compounded. High glyphosate levels combined with the presence of RMP facilities suggest these areas face dual exposures: from glyphosate itself and other hazardous chemicals managed by these facilities. This dual exposure can have cumulative effects on human health and the environment, exacerbating risks and necessitating targeted intervention strategies.
Understanding this relationship can guide regulatory bodies in refining their monitoring and mitigation strategies. It underscores the need for integrated environmental policies that consider both agricultural and industrial chemical exposures.
Overall, the environmental and socioeconomic model predictions suggest that Roanoke and Covington require more rigorous testing and reporting for glyphosate levels. This case study can more broadly be used to guide testing protocol and resource allocations for local, state, and national environmental agencies, allowing for more accurate, efficient contamination control where necessary.
Limitations and Future Research
Glyphosate’s effects on humans and disproportionate usage in impoverished communities remain undetermined and debated.
Overall, future research must focus on long-term health impacts and promoting safer alternatives, integrating scientific research and robust policies to safeguard health and the environment. Additionally, the machine learning models developed in this study have demonstrated their utility in identifying high levels of glyphosate in areas that do not report usage, as shown through the predictions for Roanoke and Covington. The better-performing environmental model, which identified RMP facilities and lead paint as significant features, can guide future testing protocols and resource allocation for local, state, and national environmental agencies, enabling more efficient and targeted contamination control.
Despite achieving high accuracy, the model did not contain any significantly high correlations (possibly due to data quality from EPA and USGS). Thus, the model prediction was influenced by a combination of numerous subtle and complex factors rather than a few strong correlations. While more research must be conducted on model interpretability, this underscores the utility of machine learning, specifically tree models, in environmental management because they can uncover hidden patterns in high-dimensional data that typical statistical analyses may miss, guiding targeted environmental testing strategies and improving resource allocation.