
Introduction
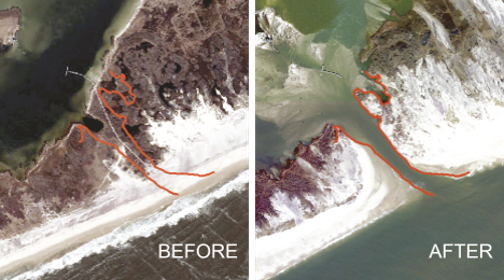
On October 29th, 2012, Hurricane Sandy stood as a powerful and unforgettable chapter in the history of natural disasters that have shaped the American landscape. This superstorm, which struck the northeastern United States, left a trail of destruction on coastal communities. Among the most notable impacts was the creation of a breach on Fire Island, a slender barrier island situated off the South Shore of Long Island, New York (Stony Brook University, 2017). The breach, a colossal rip in the island’s defenses, became an emblem of the storm’s destruction, allowing the relentless invasion of seawater and altering the island’s ecology in its wake. This storm created a barrier island breach within the eastern extent of Great South Bay (GSB) in a location previously known as Old Inlet, named as such because there was an inlet present in this area during the early 1800s, which subsequently closed. This new breach, now called the New Inlet, pictured in Figure 1, has impacted many physical, chemical, and biological aspects of this ecosystem (Elliott et al., 2016).

Fragile barrier islands contribute to the vulnerability of lagoonal estuaries, as tropical storms and hurricanes can cause large-scale disturbances. These natural events often result in breaches of protective barrier islands, forming new inlets that enhance coastal ocean exchange (Gobler et al., 2019). The South Shore of Long Island, NY, exemplifies these dynamics. The South Shore Estuary Reserve, a series of bar-built lagoonal estuaries formed nearly 10,000 years ago due to glacial activity, stretches over 100 kilometers east from New York City (Schubel et al., 1991). The largest of these estuaries, the GSB, has experienced the temporary creation of 28 inlets by storms within the last 300 years (Leatherman, 1985).
Exploring the consequences of a storm-induced breach on Fire Island offers insight into how natural forces can change this coastal environment. Tidal exchange between barrier island lagoon estuaries and ocean waters through inlets significantly influences estuarine characteristics such as temperature, salinity, and water clarity. The low rates of tidal exchange observed in many lagoonal estuaries lead to nutrient accumulation from freshwater sources, fostering highly productive food webs (Kjerfve & Magill, 1989). However, this also makes them susceptible to eutrophication, characterized by the infusion of abundant nutrients, predominantly nitrogen and phosphorus, into aquatic ecosystems (USGS, 2010).
With the majority of previous research explaining the impacts of the creation of the breach on aquatic health and environmental resilience, much less is known about the impact of water quality and ecological equilibrium after the New Inlet has closed. The purpose of this study is to evaluate the impacts of the natural closing of the Fire Island Breach on water quality and ecosystem stability in the GSB.
Literature Review
In the literature review to follow, the storm-induced Fire Island breach, resulting from Hurricane Sandy’s storm surge, will be discussed. Studying the process of the closing of the breach and its connection with water quality is crucial for understanding the significant impact on the diverse ecosystems of the GSB. Many aquatic species depend on this vital waterbody for their survival. First, delving into the intricacies of the historical context of the Fire Island breach is crucial for unraveling the ecological significance that this geographical feature embodies. Moving forward, this examination will include a comprehensive evaluation of pre-closure water quality and abiotic factors. By analyzing the state of water quality before the breach closure, a baseline can be established to measure changes and gauge the impact on the ecosystem. Afterwards, a closer examination of the repercussions for ecosystem stability will be undertaken. This exploration accentuates the issue’s growing importance within the realm of environmental research and conservation.
Historical Context of Storm-Induced Fire Island Breach
Coastal barrier island systems serve vital economic and environmental roles. They serve as essential protective barriers, mitigating erosion and wave-induced damage by absorbing wave energy and storm surges (Stone & McBride, 1998). Historical records and maps dating back to the 1700s provide evidence of periodic breaches and the formation of new inlets along the barrier island system on the southern coast of Long Island (Leatherman & Allen, 1985). Human-made structures have been used to stabilize these breaches, mainly for navigational purposes, such as Shinnecock and Moriches Inlets (Impacts of Barrier Island Breaches, 2001). Nevertheless, the topographical characteristics of Fire Island have experienced alterations over history due to storms and other significant events.
Hurricane Sandy, the largest storm on record in the Atlantic basin, spanned nearly 2,000 kilometers (Hinrichs et al., 2016). Coinciding with astronomical high tides, it profoundly impacted the eastern US coast. At its peak, the storm produced a record wave height of 9.6 meters, documented by the offshore wave buoy near Fire Island, New York (Hapke et al., 2013). Fire Island experienced breaches in three locations, and substantial damage to coastal infrastructure, including numerous private residences. Following the US Army Corps of Engineers’ Breach Contingency Plan, two breaches were quickly closed, but a third, the New Inlet on federal land within Fire Island National Seashore, remained open (Gobler et al., 2019).
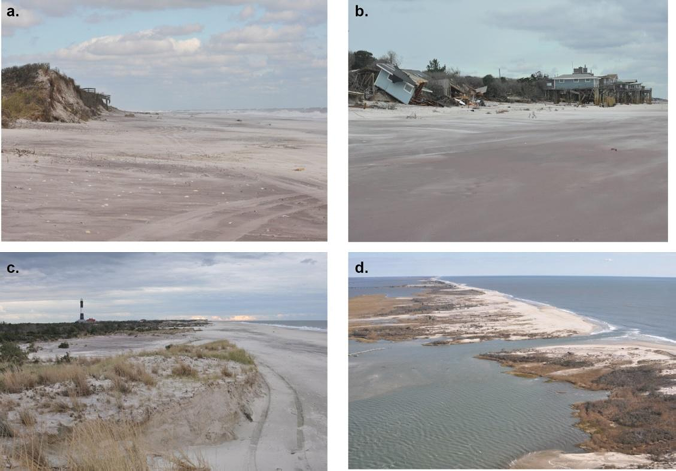
Over four years, the New Inlet migrated westward by about 200 meters. Research by Hapke (2013) and colleagues found its cross-sectional area remained stable at around 400 square meters with a consistent depth of six meters. Models suggest increased flushing rates in the east GSB, altering residence time and potentially impacting natural resources (Hinrichs et al., 2018). Hurricane Sandy left a lasting impact on Fire Island’s topography, causing significant erosion and breaches along its eastern shoreline, as shown in Figure 2 below.

The upper beach experienced an average landward shift of 19.7 meters. This event led to a substantial loss of 54.4 percent of pre-storm volume in beaches and dunes, with 46.6 percent of the island experiencing dune overwash (Hapke et al., 2013). Inland overwash deposits accounted for 14 percent of the volume loss, indicating that a majority of the material was transported offshore. As a result, Hurricane Sandy brought about significant alterations in Fire Island’s topography, rendering it more vulnerable to future storms due to its low elevation and relief.
Changes in Abiotic Factors and Coastal Dynamics
Abiotic elements such as salinity, temperature, and sedimentation wield significant influence in shaping coastal ecosystems. Coastal marine ecosystems confront a range of effects stemming from a combination of human-induced activities and climatic variables. Notably, the eastern coast of the United States stands particularly vulnerable to the impacts of hurricanes and tropical storms (Paerl et al., 2001).
The morphological changes resulting from Hurricane Sandy have facilitated the inflow of ocean water into the bay, leading to a significant nutrient influx in the GSB (Kinney & Valiela, 2011). Eutrophication is a pressing global issue, notably in coastal regions such as the GSB. In light of the 2012 Hurricane Sandy-induced breach on Fire Island, the ramifications of eutrophication have become increasingly evident by introducing additional nutrients, such as nitrogen and phosphorus, into the water system (Kinney & Valiela, 2011). Yang (2008) and his colleagues note that this influx of nutrients can elevate the overall nutrient load in the water, fostering the rapid growth of algae and triggering algal blooms.
Instances of storm-induced barrier breaches can also introduce alterations in aspects of water quality. The breach leads to the influx of seawater into the coastal area, thereby prompting shifts in salinity levels. The quality of water in aquatic environments emerges as a primary limiting factor, thus a rigorous evaluation of water quality and environmental conditions is imperative (Zhang et al., 2020). This breach has led to an increase in salinity levels as seawater from the ocean infiltrates the bay, impacting the distribution of aquatic species (Hinrichs et al., 2016). Furthermore, this breach has altered nutrient dynamics, potentially leading to nutrient influx, changes in primary productivity, and the risk of algal blooms, ultimately affecting the health of aquatic life and water clarity in the bay (Gobler et al., 2019). The influx of seawater from the ocean has disrupted the habitats and migration patterns of various species, leading to shifts in the distribution of marine organisms (Stony Brook University, 2017). This underscores the importance of maintaining a delicate equilibrium to maintain ecosystem stability and biodiversity.
Effects on Ecosystem Stability and Biodiversity
Barrier islands serve as habitats for diverse wildlife, including birds and invertebrates, and help maintain estuarine conditions in coastal lagoons, supporting crucial marine species like seagrass beds. Reid (1957) claims that tidal inlets shape the physical and biological characteristics of these ecosystems due to the delicate nature of many back bay systems. Barrier islands are dynamic environments influenced by wind, waves, tides, currents, and storms. Leatherman and Allen (1985) revealed recurring breaches at specific locations along the barrier island, while Center and Conley (2000) noted that these events impact island habitats and water quality, affecting the organisms residing there. Thus, the creation of a breach is significant for ecosystem stability and biodiversity.
For example, after the formation of Moriches Inlet in New York, Glancy (1956) observed an increase in predators and a decline in oyster sets within Moriches Bay, alongside increased flushing rates and improved water quality. Similarly, Gobler (2019) and colleagues found that ocean flushing in the eastern GSB and western Moriches Bay improved water clarity, benefiting the local seagrass community, which had declined since the early 1980s due to sunlight limitation. Monitoring flora and fauna affected by breaches is essential to determine their ultimate impact on ecosystem function.
Before the New Inlet’s establishment, summer water temperatures in GSB often exceeded 25 °C, stressing Zostera marina and hard clams (Short et al., 2011; Touchette et al., 2003). The New Inlet significantly reduced summer temperatures near the area, thanks to enhanced ocean exchange. Additionally, the New Inlet mitigated brown tides, which are harmful to seagrasses, zooplankton, and other bivalves (Gobler & Sunda, 2012). This mitigation benefits the entire marine ecosystem, positively influencing seagrasses, zooplankton, and various bivalves, highlighting the intricate relationships within coastal marine ecosystems and the importance of considering multiple factors when assessing overall stability and biodiversity.
Thus, instead of examining the effects of the breach’s formation, this study explores the closure of the Fire Island breach and uncovers its intricate relationship with water quality in the GSB. The ensuing analysis explores the alterations in abiotic factors, such as salinity and nutrient dynamics, impacting water quality. The breach’s implications extend to ecosystem stability and biodiversity, affecting seagrass beds and diverse marine species. Examining the water quality in the GSB and its progression over time enables the assessment of ecosystem health, providing insights into the impact of the closing of the breach on aquatic ecosystems.
Methodology
Previous research has illuminated the profound relationship between testing water quality and gaining valuable insights into biodiversity and ecosystem stability, particularly in regions highly affected by pollution and human activity (Gobler et al., 2019)). This investigation examines the repercussions of the New Inlet closure on water quality and ecosystem stability within the GSB. Furthermore, this study seeks to explore the broader implications of this closure on the surrounding environment, including its potential impacts on marine life, habitat dynamics, and coastal processes. Since March of 2016, the gradual closure of this breach has been evident, suggesting potential decreases in water quality and ecosystem stability now that the breach has officially closed and prevents the flow of water from the ocean to the bay. In contrast to numerous prior studies (Gobler et al., 2019; Paerl et al., 2001; Stony Brook University, 2017) that have utilized water quality monitoring to assess the consequences of an establishment of a breach, this research seeks to examine how the closure of such breaches can alter water quality dynamics. Through analysis of various environmental parameters and ecological indicators, this study aims to provide a comprehensive understanding of how the closure of the Fire Island Breach influences the delicate balance of the GSB ecosystem.
Site Locations
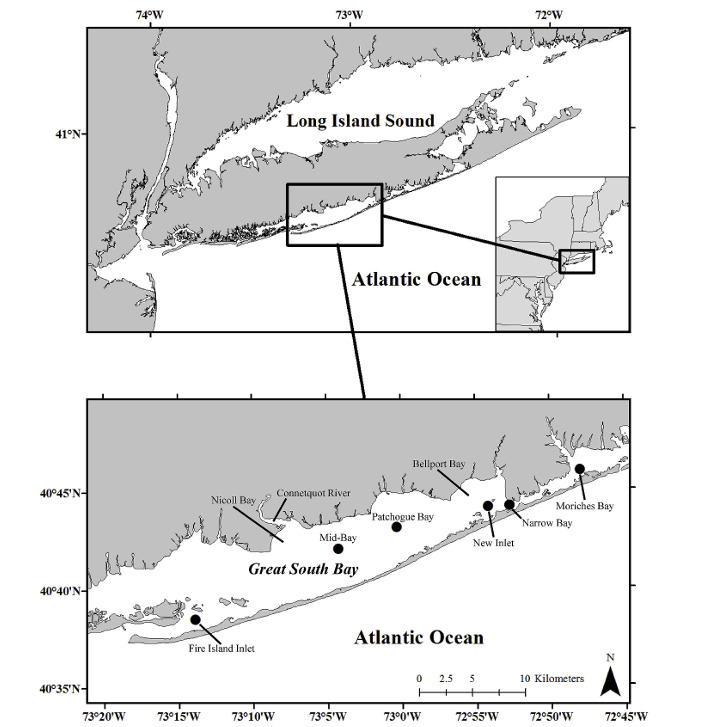
To comprehensively assess the impact of the breach closure on water quality, it was imperative to gather data from various locations surrounding the breach. Each chosen site corresponded to a designated Bay Station in the Suffolk County Department of Health Services (SCDHS) database shown in Figure 3, ensuring methodical and consistent comparisons. Water samples were collected from diverse points across the GSB with varying proximity to the breach depicted in Table 1 below.
On-Site Collection and Water Quality
At each testing location, the date and time in military time were recorded, and a digital thermometer was immersed 10 inches into the water to gauge the temperature in degrees Celsius. To gather samples, a 1000mL amber-glass bottle was submerged underwater and sealed beneath the surface once filled. After collecting all bottles, the evaluation of water quality in the GSB, centered around measuring the levels of dissolved oxygen, nitrogen, phosphate, coliform, and pH. Dissolved oxygen levels signify the quantity of gaseous oxygen dissolved in the water, sourced from the surrounding air, aeration (rapid movement), and as a byproduct of photosynthesis. For assessing dissolved oxygen levels, a CHEMets kit was employed. 10 mL of bay water was poured into a beaker, followed by breaking the glass within the kit. Matching the color to the results key allowed determination of the dissolved oxygen concentration.
The bay’s nitrogen, phosphate, and coliform levels were determined using a LaMotte Water Quality Monitoring Kit and tablets were placed in beaker with 10 mL of bay water. To test for turbidity, a Secchi disk was attached to a two-meter stick and slowly lowered vertically into the water until it was no longer visible. The depth at which the disk disappeared was recorded as a measure of water clarity. Deeper disappearance indicated clearer water, while shallower depths suggested higher turbidity due to suspended particles. While nutrients like nitrogen and phosphorus are vital for plant and animal growth, an excess of these compounds in water can lead to various adverse health and ecological effects. Furthermore, the presence of coliform bacteria indicates water contamination with feces or sewage, carrying the potential to cause diseases. The pH levels were determined using pH strips and serve as an indicator of the water’s acidity level. Lastly, salinity levels were measured using a salinity probe.
All experimental values were entered with collected values. Coliform bacteria presence was denoted by a value of 1 for positive and 0 for negative results. Weather conditions were coded as 1 for sunny and 2 for partly cloudy. Watercolors were assigned numerical codes: 1 for blue, 2 for green, and 3 for brown. In cases where water exhibited a combination of colors, corresponding combinations of these numerical codes were employed for accurate representation in the dataset.
Historical Comparison and Analysis
An extensive dataset spanning from 1976 to 2023, compiled by the Suffolk County Department of Health Services (SCDHS) in New York, USA, was subjected to rigorous analysis. The primary objective was to discern and contrast water quality conditions preceding and following the closing of the New Inlet in the GSB region. This comprehensive dataset curated over 47 years, served as the cornerstone for comparative analysis. The focal point of the investigation was to highlight any discernible shifts or patterns in water quality metrics before and after the introduction of the New Inlet in the GSB. The analysis of this extensive dataset serves not only to delineate temporal trends but also to underscore the importance of proactive monitoring in safeguarding water quality and ecological balance. Once the data at each site location was collected and measured, the experimental data was used to compare the water quality data from 2023 when the breach was closed to the data in 2013 after the breach was initially opened, and 2011 before Hurricane Sandy.
Results
Upon gathering water samples from various locations and conducting the specified tests, the following results were observed (see Tables 2-4 below). Results were collected in 2011, 2013, and 2023 to witness the changes in specified water quality quantities over time.
Once collected, the experimental data underwent transformation into numerical values and was subsequently analyzed using JASP, Jeffery’s Amazing Statistical Program. This analysis generated the means and SD of each sample (Table 5 below) along with the ANOVA value for each variable in comparison to the variable it was compared to. ANOVA, or Analysis of Variance, is a statistical method that compares the means of multiple groups to determine if there are significant differences between them. In the context of water quality data over time, ANOVA can help identify if there are significant changes in the experimentally collected data across different time periods. The ANOVA results (Table 6 below) indicated noteworthy findings regarding the variability of water quality parameters over time. Specifically, it was determined that significant differences existed among at least one pair of group means.
Notably, for temperature, F(2, 9.122) = 7.353, **p = 0.004, it was determined that there were statistically significant differences in means observed over time. Similar significant differences were identified for nitrate, F(2, 412.144) = 19.230, ***p < .001, dissolved oxygen, F(2, 61.155) = 154.080, ***p < .001, pH, F(2, 2.313) = 23.956, ***p < .001, and salinity, F(2, 74.334) = 9.965, ***p < .001, indicating substantial variations in these parameters over time.
However, the mean differences in turbidity, F(2, 3.969) = 2.072, p = n.s., and watercolor, F(2, 0.902) = 3.233, p = n.s., were found to lack statistical significance across the time periods examined.
It is important to note that while ANOVA tests confirm the presence of differences among group means, they do not specify which specific groups or years exhibit disparate means. Instead, they offer evidence supporting the existence of variability among the groups under examination.
Thus, post hoc tests were conducted (Table 7 below) after obtaining significant results (*p < .05 or greater) from ANOVA to exemplify exactly where these differences occur. These tests helped to determine which specific time periods exhibit significant differences in means of specific water quality results. This provided a more detailed understanding of the temporal variations in water quality and allowed for comparisons between values before and after the closing of the breach.
Post hoc comparisons using the Tukey HSD test indicated that the mean temperature in 2011 (M = 11.200, SD = 0.709) was significantly different than the mean temperature in 2013 (M = 9.725, SD = 1.711). In addition, the difference in mean temperature between 2011 and 2023 (M = 9.125, SD = 0.539) was also deemed significant. The positive mean difference between each year demonstrates how the temperature of the GSB has decreased over time.
As for dissolved oxygen, there was a significant negative mean difference between the years 2011 (M = 9.400, SD = 0.513) and 2013 (M = 10.300, SD = 0.719) demonstrating that the dissolved oxygen levels increased after 2011. Yet, there was a significant positive mean difference between the years 2013 and 2023 (M = 5.125, SD = 0.641), as well as 2011 to 2023. This demonstrates that there was an increase between 2011 and 2013, yet the levels have seen an overall net decrease from 2011 to 2023.
Mean nitrate levels were shown to stay relatively the same between 2011 (M = 0.105, SD = 0.104) and 2013 (M = 0.032, SD = 0.025). The mean nitrate levels in 2023 (M = 12.500, SD = 8.018) were significantly different than the mean nitrate levels in 2011, as well as in 2013. For the years that had a significant relationship, there was a negative mean difference between the years, demonstrating how nitrate levels increased as time progressed.
There were significant differences in the means of the levels of pH between 2011 (M = 8.000, SD = 0.185) and 2023, as well as 2013 (M = 7.987, SD = 0.099) and 2023 (M = 7.063, SD = 0.496). While the pH stayed relatively constant between 2011 and 2013, there was shown to be an average net decrease of pH over time, demonstrating acidification of the GSB.
There was a last significant relationship between the means of salinity. There was a strong significant negative mean difference between salinity levels in 2011 (M = 24.337, SD = 2.581) and 2013 (M = 30.325, SD = 0.597) demonstrating an increase in salinity. While there was no significant relationship between the years 2011 and 2023, there was a significant difference in the means between 2013 and 2023 (M = 26.338, SD = 3.920). There was a positive mean difference between those years demonstrating a decrease in salinity between 2013 and 2023. Since there is no difference in salinity between the extremes, it demonstrates that salinity levels increased, and then decreased back to the same levels it began.
Since there was no significant difference in the means indicated in the AVOVA results for turbidity and watercolor, the post hoc results further demonstrate how there was no significant difference between the means in either 2011, 2013, or 2023.
The detailed examination of post hoc results provides valuable insights into the temporal dynamics of water quality parameters within the GSB, highlighting notable trends and shifts that have occurred over the study period.
Discussion and Conclusion
This study aimed to understand how the closing of the Fire Island breach impacted water quality and ecosystem stability in the GSB. After the collection of water samples and water quality tests were run, statistical analysis was performed.
The findings show a decrease over time in the mean temperature of the GSB after the breach’s closure. The end of the ocean-bay exchange resulted in a loss of heat from the warmer ocean inflow, gradually lowering the water body’s overall heat content. These results align with Gobler’s research, which showed a decline in average water temperature and an increase in water clarity due to lower flushing times (Gobler et al., 2019). The breach’s closure can lead to water stagnation, reducing mixing between temperature layers and promoting stratification. Hinrichs (2018) noted a significant decrease in flushing time after the breach, indicating greater flushing when the breach was open. Without the warm ocean water, the water body cools more from its surroundings, contributing to the temperature decrease over time.
There was a net decrease in dissolved oxygen between 2011 and 2023, with an increase between 2011 and 2013. Since the breach was created around 2013, the results suggest that the breach allowed polluted or nutrient-rich water to flow out into the ocean. Gobler (2019) found increased dissolved oxygen levels after the breach’s creation, improving seagrasses and bivalves, such as increased juvenile hard clam growth near the New Inlet. The breach likely increased nutrient input into the ocean, improving water quality and oxygen levels in the bay. However, after the breach’s closure, limited water influx may have decreased dissolved oxygen in the GSB.
Nitrate levels increased over time. Initially, the breach may have diluted nitrate concentrations by facilitating bay water outflow. With the breach closed, this effect diminished, allowing nitrate levels to rise. Accumulated nutrients, including nitrate-rich runoff, may become trapped in the bay due to reduced flushing. Kinney (2011) noted that reduced water exchange limits the dispersion of anthropogenic inputs, leading to their accumulation and increased nitrate concentrations. This nutrient accumulation can stimulate algal growth, impacting overall water quality within the bay ecosystem (Yang et al., 2008).
A significant inverse relationship was observed between pH and time, with pH declining steadily. The closure of the breach can lead to acidification due to several factors. Initially, the breach allowed alkaline ocean water inflow, which increased the bay’s pH. With the breach sealed, reduced alkaline ocean water inflow decreases the pH. Additionally, stagnant conditions foster the accumulation of organic matter and nutrients, which decompose and release acidic compounds, further lowering the pH. Anthropogenic inputs like urban runoff and industrial discharges, containing acidic compounds, are no longer flushed out, exacerbating acidification (Kinney & Valiela, 2011). This pH decrease can negatively affect the growth and survival of early life stage bivalves (Gobler et al., 2014).
There was a significant increase in salinity between 2011 and 2013 after the breach was created, followed by a decrease as the breach began to close. The creation of a breach typically increases bay salinity, as higher salinity ocean water flows into the bay (Gobler et al., 2019). However, as the breach closes, ocean water inflow diminishes, reducing the mixing of ocean and bay water, leading to lower salinity levels within the bay.
Ultimately, the closure of the Fire Island Breach holds significant importance due to its direct influence on the ecological dynamics and water quality of the GSB. This study substantiates multiple findings established within the literature review, strengthening the comprehension of breach closure’s ramifications on water quality parameters. Through examination of correlations identified within the Post hoc and ANOVA assessments, and alignment of results with those from Suffolk County Department of Health Services, the relationship between the breach closure and shifts in water quality dynamics within the GSB is illuminated.
Limitations and Future Directions
While this study provides valuable insights into the impacts of closing the Fire Island breach on water quality and ecosystem stability in the GSB, several limitations should be considered. The study’s findings may be subject to temporal constraints, as it only captures changes within a specific timeframe, potentially missing longer-term trends. Additionally, the focus on a particular area within the GSB might overlook spatial heterogeneity in water quality dynamics, limiting the generalizability of the findings.
The resolution of data collected for water quality parameters may vary, leading to potential gaps or inconsistencies. Higher-resolution data with more frequent sampling could enhance the robustness of the conclusions. Moreover, the study may not fully account for all external factors influencing water quality, such as seasonal variations, weather patterns, and anthropogenic activities.
Future research should include long-term monitoring beyond the current timeframe and location to capture broader changes in water quality parameters. Adopting a comprehensive spatial approach with sampling across various locations within the bay would account for spatial heterogeneity and provide a more representative understanding of breach closure’s influence on ecosystem stability.